📊 Gold Daily Analysis for 13th January 2025 Key Levels and Trade Setups
- Neom
- Jan 13, 2025
- 2 min read
In the ever-volatile gold market, identifying critical price levels is essential for making informed trading decisions. This blog provides a comprehensive analysis of Gold for 13th January 2025, highlighting resistance and support levels, swing levels, and trade setups based on technical indicators.
📊 Current Market Overview
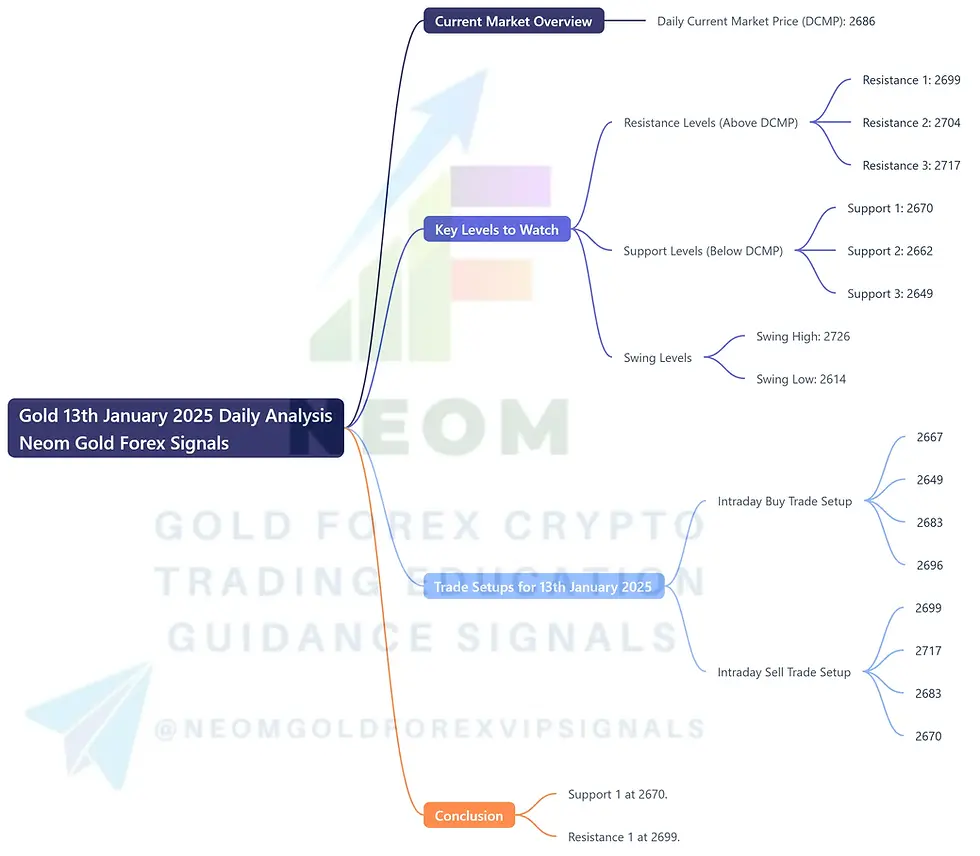
The Daily Current Market Price (DCMP) of Gold is 2686, a pivotal figure around which key resistance and support levels are identified.
🔍 Key Levels to Watch
Resistance Levels (Above DCMP):
🔴 Resistance 1: 2699
🔴 Resistance 2: 2704
🔴 Resistance 3: 2717
Support Levels (Below DCMP):
🟢 Support 1: 2670
🟢 Support 2: 2662
🟢 Support 3: 2649
Swing Levels:
Swing High: 2726
Swing Low: 2614
These levels offer significant zones for potential reversals, providing excellent opportunities for both buying and selling trades.
🔍 Technical Analysis
Gold's current price of 2686 is positioned between strong resistance and support levels. Resistance levels above this price act as potential selling zones, while support levels below it serve as buying opportunities.
Here’s a breakdown of the technical indicators:
Fibonacci Levels: The resistance and support levels align closely with key Fibonacci retracement and extension zones, confirming their importance.
RSI Divergence: RSI indicates overbought conditions near resistance levels and oversold conditions near support, signaling potential reversals.
MACD Crossing: Momentum is neutral but shows signs of shifting, aligning with the suggested trade setups.
Trade Setups for 13th January 2025
Intraday Buy Trade Setup
📍 Entry Price: 2667
🛡️ Stop Loss: 2649
🎯 Take Profit 1: 2683
💰 Take Profit 2: 2696
This trade setup focuses on the Support 1 level at 2670, which aligns with the pivot and Fibonacci retracement zones. RSI suggests oversold conditions, and MACD indicates early signs of bullish momentum, making this a strong level for a potential upward bounce.
Intraday Sell Trade Setup
📍 Entry Price: 2699
🛡️ Stop Loss: 2717
🎯 Take Profit 1: 2683
💰 Take Profit 2: 2670
This trade setup targets the Resistance 1 level at 2699, which aligns with the pivot and Fibonacci extension zones. RSI indicates overbought conditions, and MACD signals bearish divergence, suggesting a potential rejection and downward movement.
Conclusion
Gold’s DCMP of 2686 positions it between critical resistance and support levels. The 2670 support level provides an excellent buying opportunity, while the 2699 resistance level offers a strong selling zone. These levels, combined with technical indicators such as RSI, MACD, and Fibonacci levels, provide a structured approach to trading Gold on 13th January 2025.


Comments