🟡 BTCUSD Daily Market Analysis – 6 May 2026
- Neom
- Jun 6
- 3 min read
Introduction
The cryptocurrency market is highly volatile, and Bitcoin (BTC) remains at the forefront of this dynamic landscape. As of today, the BTC/USD pair is trading at $59,760. In this comprehensive analysis, we will delve into the daily and 4-hour timeframes using various technical indicators, including Fibonacci Retracement Levels, Exponential Moving Averages (EMA), RSI divergence, and more. This analysis aims to provide traders with a clear understanding of the current market conditions and potential trading opportunities.
Market Overview
Current Price: $59,760
Bitcoin's price has shown significant movement in recent weeks, and understanding the key levels of support and resistance is crucial for traders looking to capitalize on market fluctuations.
Technical Indicators Analysis
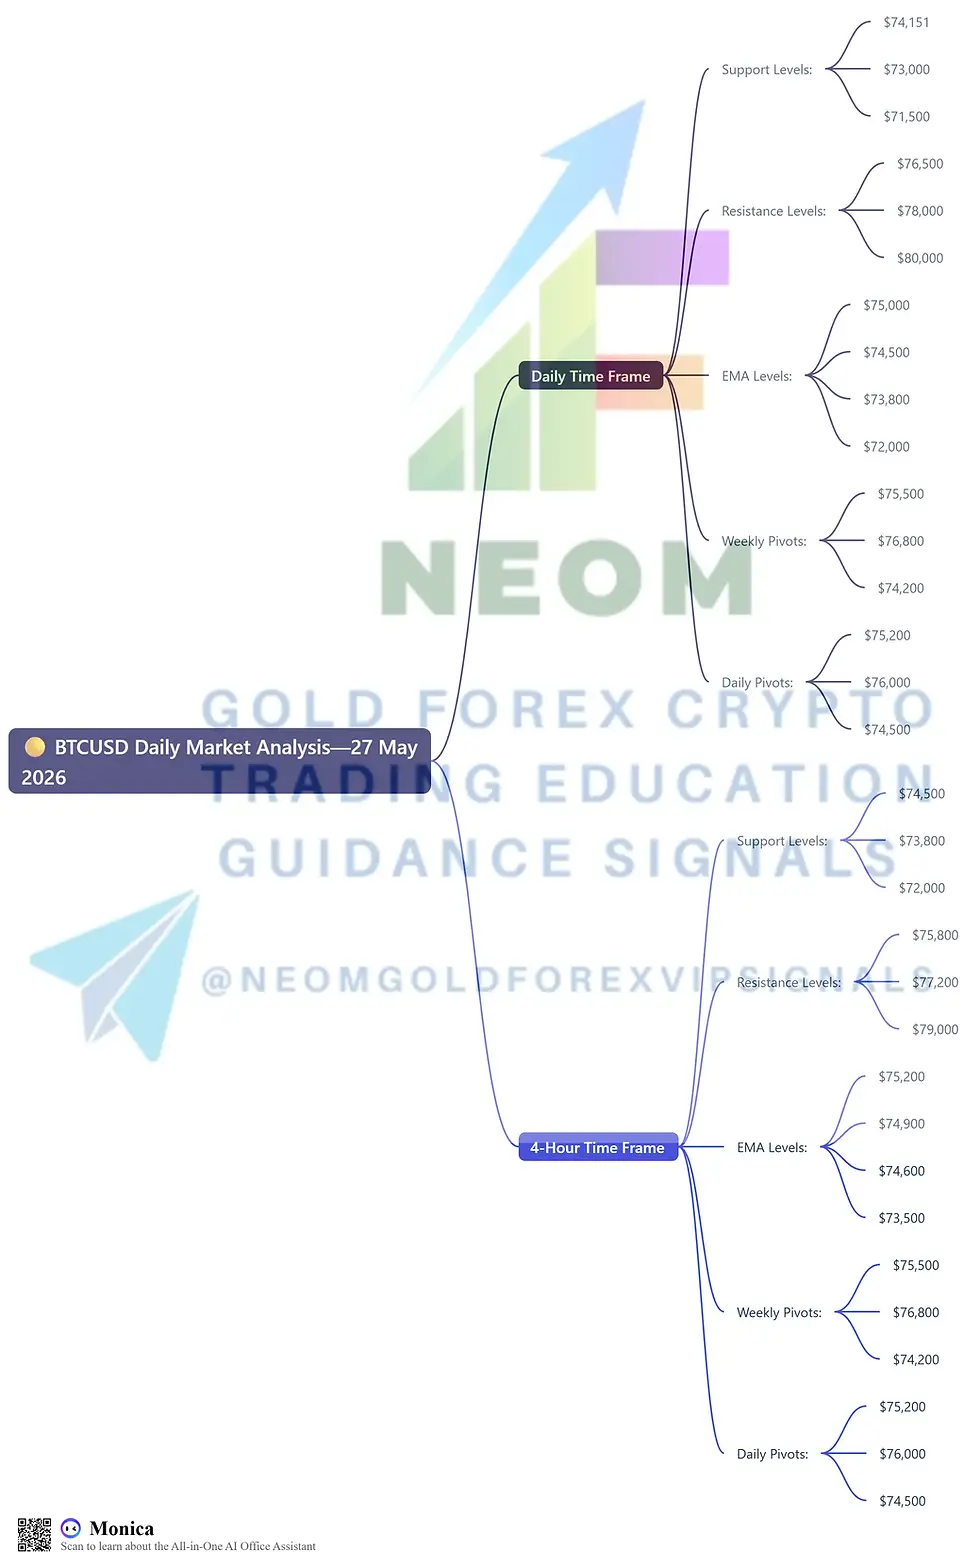
1. Support & Resistance Levels
Daily Timeframe:
Support Levels:
S1: $58,500
S2: $57,200
S3: $55,800
Resistance Levels:
R1: $60,500
R2: $61,800
R3: $63,000
4-Hour Timeframe:
Support Levels:
S1: $59,000
S2: $58,700
S3: $58,000
Resistance Levels:
R1: $60,000
R2: $60,800
R3: $61,500
2. Fibonacci Retracement Levels
Fibonacci Retracement levels are vital in identifying potential reversal points in the market. Based on the recent swing high of $43,810 and swing low of $39,280, the key Fibonacci levels are as follows:
23.6%: $41,600
38.2%: $40,800
61.8%: $39,500
These levels serve as critical areas where price action may react, providing traders with insights into potential entry or exit points.
3. Exponential Moving Averages (EMA)
The EMA is an essential tool for identifying trends and potential reversals. Here are the EMA levels based on the current market price:
Daily Timeframe:
EMA (50): $59,200
EMA (100): $58,500
EMA (200): $57,800
EMA (400): $56,500
4-Hour Timeframe:
EMA (50): $59,600
EMA (100): $59,300
EMA (200): $59,000
EMA (400): $58,700
4. RSI Divergence
The Relative Strength Index (RSI) is a momentum oscillator that measures the speed and change of price movements. Currently, the RSI is showing a divergence, indicating a potential reversal in the trend.
Current RSI Level: 65 (indicating overbought conditions)
Divergence: The price is making higher highs while the RSI is making lower highs, suggesting a possible correction.
5. Order Blocks
Order blocks are crucial areas where significant buying or selling has occurred in the past. Identifying these blocks can help traders understand potential support and resistance levels.
Bullish Order Block: $58,500 - $59,000
Bearish Order Block: $60,500 - $61,000
6. MACD Analysis
The Moving Average Convergence Divergence (MACD) is a trend-following momentum indicator that shows the relationship between two moving averages of a security's price.
Current MACD Line: 0.12
Signal Line: 0.10
Histogram: 0.02
The MACD is currently bullish, indicating that the momentum is in favor of buyers, but traders should remain cautious of potential reversals.

Summary of Key Levels
Daily & 4-Hour Support and Resistance
Daily Support: $58,500, $57,200, $55,800
Daily Resistance: $60,500, $61,800, $63,000
4-Hour Support: $59,000, $58,700, $58,000
4-Hour Resistance: $60,000, $60,800, $61,500
Exponential Moving Average (EMA) Levels
Daily EMA (50): $59,200
Daily EMA (100): $58,500
Daily EMA (200): $57,800
Daily EMA (400): $56,500
4-Hour EMA (50): $59,600
4-Hour EMA (100): $59,300
4-Hour EMA (200): $59,000
4-Hour EMA (400): $58,700
Weekly Pivots
Weekly Pivot Point: $59,500
Weekly Resistance Levels: $60,000, $60,500
Weekly Support Levels: $58,000, $57,500
Daily Pivots
Daily Pivot Point: $59,760
Daily Resistance Levels: $60,300, $60,800
Daily Support Levels: $58,900, $58,400
Conclusion
In conclusion, the BTC/USD market presents a mix of opportunities and challenges for traders. The current price of $59,760 is at a critical juncture, with various indicators suggesting potential movements. By closely monitoring the support and resistance levels, Fibonacci levels, and EMA trends, traders can make informed decisions.


Comments