🟡 BTCUSD Daily Market Analysis—27 May 2026
- Neom
- May 27
- 3 min read
Introduction
In the ever-evolving world of cryptocurrency, Bitcoin (BTC) continues to capture the attention of traders and investors alike. As of today, May 27, 2026, Bitcoin is trading at $75,206. This analysis will delve into the daily and 4-hour time frames, utilizing various technical indicators such as Fibonacci Retracement Levels, Exponential Moving Averages (EMA), RSI divergence, and more. By understanding these elements, traders can make informed decisions in this volatile market.
Market Overview
Current Price
BTCUSD Live Price: $75,206
Swing Levels
Swing High: $82,835
Swing Low: $74,151
Technical Indicators Analysis
1. Support & Resistance Levels
Daily Time Frame
Support Levels:
First Support: $74,151 (Swing Low)
Second Support: $73,000 (Psychological Level)
Third Support: $71,500 (Previous Low)
Resistance Levels:
First Resistance: $76,500 (Recent High)
Second Resistance: $78,000 (Round Number)
Third Resistance: $80,000 (Psychological Level)
4-Hour Time Frame
Support Levels:
First Support: $74,500 (Recent Low)
Second Support: $73,800 (Order Block)
Third Support: $72,000 (Previous Low)
Resistance Levels:
First Resistance: $75,800 (Recent High)
Second Resistance: $77,200 (Fibonacci Level)
Third Resistance: $79,000 (Round Number)
2. Fibonacci Retracement Levels
Fibonacci retracement levels provide insights into potential reversal points. Based on the swing high of $82,835 and swing low of $74,151, the key Fibonacci levels are as follows:
23.6% Level: $76,500
38.2% Level: $78,000
61.8% Level: $80,000
These levels can act as potential resistance points as the price approaches them.
3. Exponential Moving Averages (EMA)
Daily Time Frame
EMA 50: $75,000
EMA 100: $74,500
EMA 200: $73,800
EMA 400: $72,000
The EMAs indicate a bullish trend as the price is above the 50 EMA, suggesting upward momentum.
4-Hour Time Frame
EMA 50: $75,200
EMA 100: $74,900
EMA 200: $74,600
EMA 400: $73,500
The EMAs on the 4-hour chart also support the bullish outlook, with the price consistently above these averages.
4. RSI Divergence
The Relative Strength Index (RSI) is currently showing a divergence on the daily time frame. While the price is making higher highs, the RSI is showing lower highs, indicating a potential reversal. This divergence is crucial for traders to watch, as it may signal a weakening bullish momentum.
5. Order Blocks
Order blocks are significant areas where large buy or sell orders have previously been placed. The current order blocks on the daily time frame are identified at:
Buy Order Block: $73,800 to $74,151
Sell Order Block: $76,500 to $77,000
These blocks represent key areas of interest for potential price reversals or continuations.
6. MACD Analysis
The Moving Average Convergence Divergence (MACD) indicator is currently showing a bullish crossover on the daily chart, indicating potential upward momentum. Traders should monitor this indicator closely, as it may confirm the ongoing bullish trend.
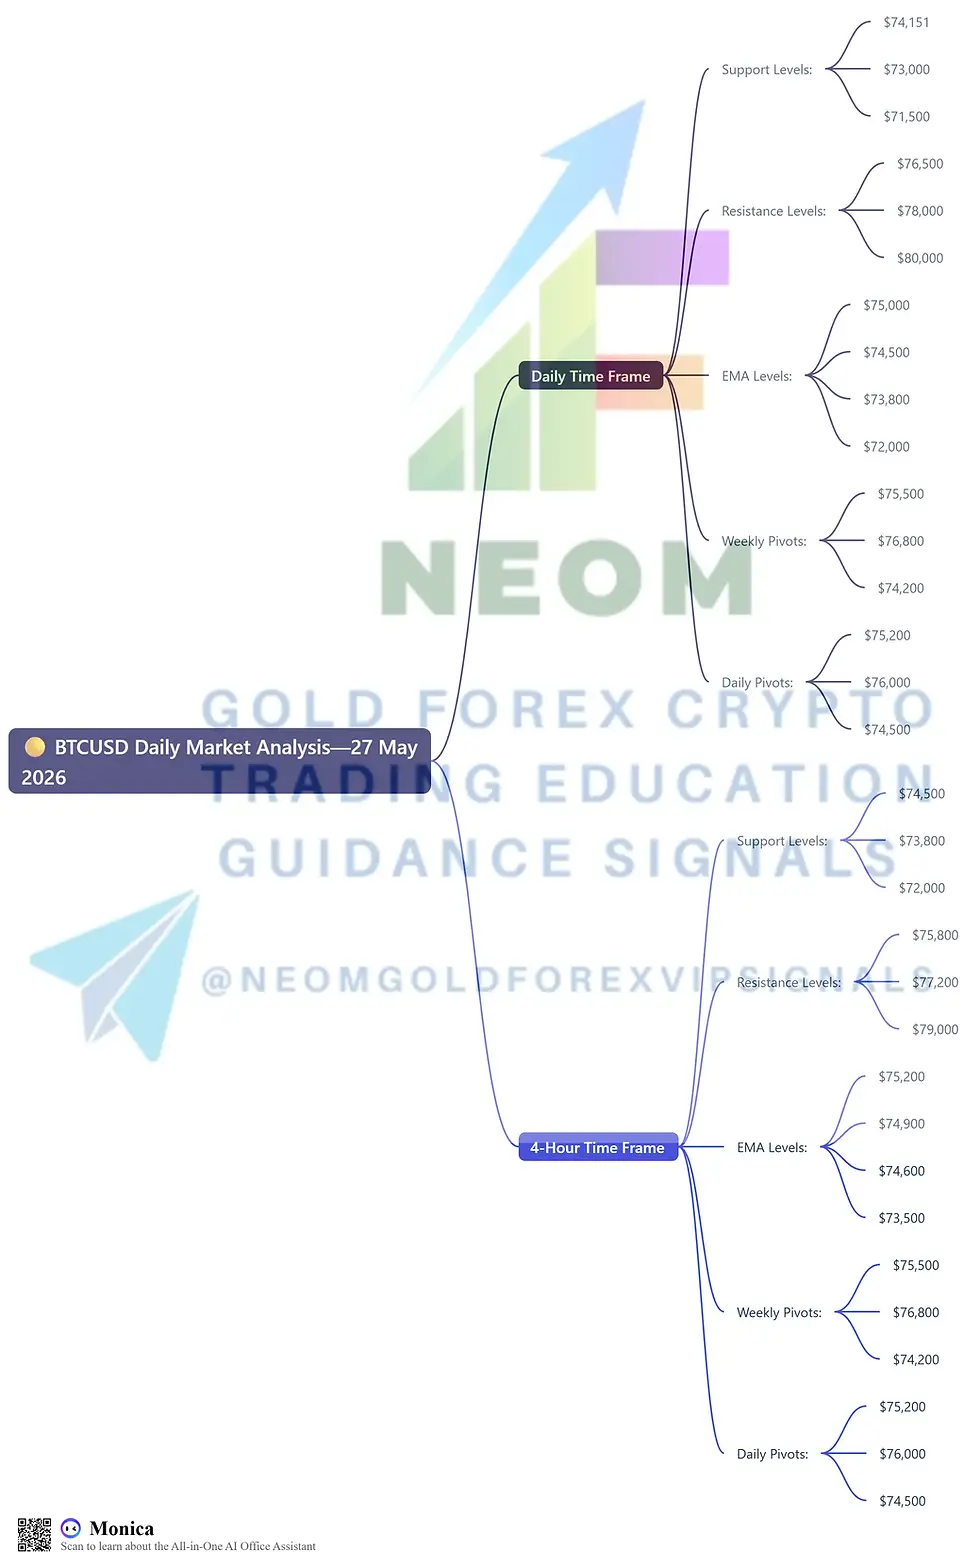
Summary of Key Levels
Daily Time Frame
Support Levels:
$74,151
$73,000
$71,500
Resistance Levels:
$76,500
$78,000
$80,000
EMA Levels:
EMA 50: $75,000
EMA 100: $74,500
EMA 200: $73,800
EMA 400: $72,000
Weekly Pivots:
Pivot Point: $75,500
Resistance 1: $76,800
Support 1: $74,200
Daily Pivots:
Pivot Point: $75,200
Resistance 1: $76,000
Support 1: $74,500
4-Hour Time Frame
Support Levels:
$74,500
$73,800
$72,000
Resistance Levels:
$75,800
$77,200
$79,000
EMA Levels:
EMA 50: $75,200
EMA 100: $74,900
EMA 200: $74,600
EMA 400: $73,500
Weekly Pivots:
Pivot Point: $75,500
Resistance 1: $76,800
Support 1: $74,200
Daily Pivots:
Pivot Point: $75,200
Resistance 1: $76,000
Support 1: $74,500
Conclusion
As we analyze the BTCUSD market for May 27, 2026, it's clear that traders must remain vigilant. The combination of support and resistance levels, Fibonacci retracement, EMAs, RSI divergence, order blocks, and MACD provides a comprehensive framework for making informed trading decisions. With Bitcoin currently at $75,206, the potential for both bullish and bearish movements exists. Traders should utilize this analysis to navigate the market effectively and capitalize on upcoming opportunities.
By following these insights and keeping an eye on the key indicators, traders can enhance their strategies and make more informed decisions in the dynamic cryptocurrency market. 🚀


Comments