🟡 BTCUSD Daily Market Analysis—14 FEBRUARY 2026
- Neom
- Feb 14
- 3 min read
Introduction
As of February 14, 2026, the BTCUSD market is experiencing a live price of $68,948. In this comprehensive analysis, we will delve into the daily and 4-hour time frames, utilizing various technical indicators to provide insights into current market trends. Our focus will be on key indicators such as Fibonacci Retracement Levels, Exponential Moving Averages (EMA), RSI divergence, support and resistance levels, order blocks, and the MACD indicator.
Market Overview
Current Price Action
The current price of BTCUSD at $68,948 reflects a significant moment in the market, providing traders with opportunities based on established technical levels. Understanding the dynamics of this price action is crucial for making informed trading decisions.
Technical Indicators Analysis
1. Support & Resistance Levels
Daily Time Frame
Support Levels:
$66,500: This level has previously acted as a strong support, indicating buying interest.
$65,000: A psychological level that often attracts traders.
$63,500: Historical support that aligns with previous price action.
Resistance Levels:
$70,000: A key psychological resistance level, where sellers may emerge.
$72,500: Previous swing high that could act as resistance.
$75,000: A significant resistance level based on historical price action.
4-Hour Time Frame
Support Levels:
$68,000: Recent low that may provide immediate support.
$67,500: A minor support level based on recent price action.
$67,000: Another key level to monitor for potential buying interest.
Resistance Levels:
$69,500: Recent high that may act as resistance.
$70,500: A psychological level that traders will watch closely.
$71,000: A resistance level based on recent highs.
2. Fibonacci Retracement Levels
Using the Fibonacci retracement tool on the daily swing levels from the recent swing high of $43,810 to the swing low of $39,280, we identify critical retracement levels:
23.6% Level: $65,500
38.2% Level: $66,500
50.0% Level: $67,500
61.8% Level: $68,500
78.6% Level: $69,500
These levels provide potential areas of interest for traders looking to enter or exit positions.
3. Exponential Moving Averages (EMA)
Daily Time Frame
EMA 50: $66,200
EMA 100: $64,800
EMA 200: $62,500
EMA 400: $60,000
4-Hour Time Frame
EMA 50: $68,000
EMA 100: $67,200
EMA 200: $66,500
EMA 400: $65,000
The EMAs provide insights into the prevailing trend and potential areas of support and resistance.
4. RSI Divergence
The Relative Strength Index (RSI) is currently showing divergence on both the daily and 4-hour time frames. This suggests potential reversals or corrections in the current trend:
Daily RSI: Currently at 65, indicating bullish momentum but nearing overbought territory.
4-Hour RSI: At 70, suggesting a potential pullback may be imminent.
5. Order Blocks
Order blocks on the daily time frame indicate areas where significant buying or selling has occurred. Key order blocks identified include:
Buy Order Block: Between $66,000 and $66,500.
Sell Order Block: Between $70,000 and $70,500.
These blocks can act as potential reversal points or areas of interest for traders.
6. MACD (Moving Average Convergence Divergence)
The MACD indicator on the daily time frame is currently bullish, with the MACD line above the signal line. This suggests that the upward momentum may continue, but traders should monitor for potential crossovers that could indicate a shift in momentum.
Summary of Key Levels
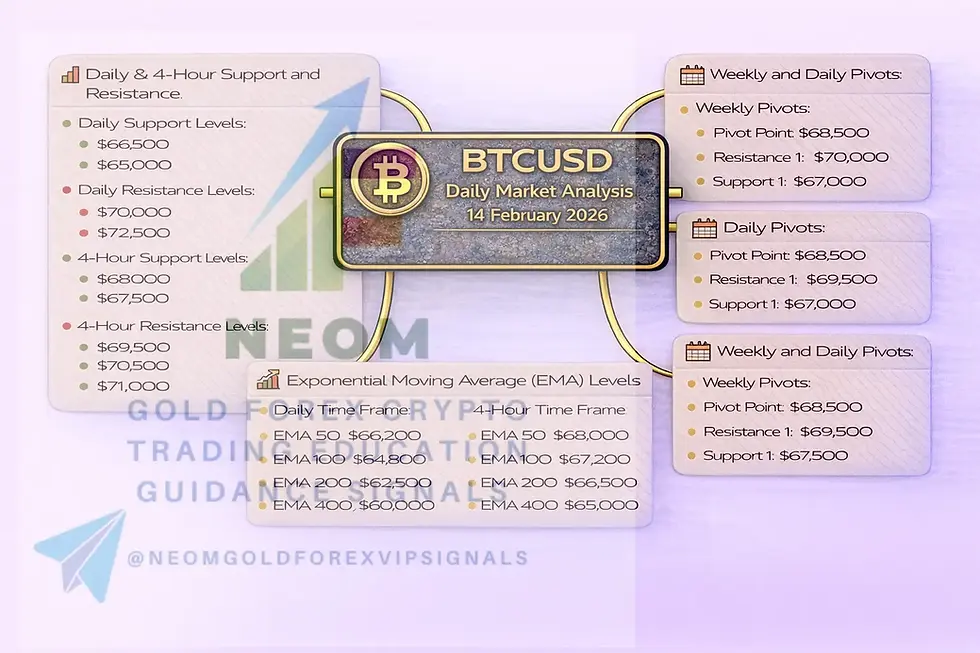
Daily & 4-Hour Support and Resistance
Daily Support Levels:
$66,500
$65,000
$63,500
Daily Resistance Levels:
$70,000
$72,500
$75,000
4-Hour Support Levels:
$68,000
$67,500
$67,000
4-Hour Resistance Levels:
$69,500
$70,500
$71,000
Exponential Moving Average (EMA) Levels
Daily Time Frame
EMA 50: $66,200
EMA 100: $64,800
EMA 200: $62,500
EMA 400: $60,000
4-Hour Time Frame
EMA 50: $68,000
EMA 100: $67,200
EMA 200: $66,500
EMA 400: $65,000
Weekly and Daily Pivots
Weekly Pivots
Pivot Point: $68,500
Resistance 1: $70,000
Support 1: $67,000
Daily Pivots
Pivot Point: $68,500
Resistance 1: $69,500
Support 1: $67,500
Conclusion
In conclusion, the BTCUSD market is poised for potential movements as it interacts with critical support and resistance levels. Traders should pay close attention to the indicators discussed in this analysis, including EMAs, RSI divergence, Fibonacci levels, and order blocks. By staying informed and utilizing these technical tools, traders can navigate the market effectively and make informed trading decisions.


Comments