🟡 XAUUSD Daily Market Analysis—May 23, 2025
- Neom
- May 23, 2025
- 3 min read
Introduction
Gold (XAUUSD) has always been a safe-haven asset, especially during times of economic uncertainty. As of today, the live market price for gold stands at $3,314 USD. In this analysis, we will delve into the daily and 4-hour time frames, utilizing various technical indicators including Fibonacci Retracement Levels, Exponential Moving Averages (EMA), RSI divergence, Weekly and Daily Pivots, Smart Money Concepts (SMC), Support & Resistance Levels, Order Blocks, and the MACD indicator. This comprehensive overview aims to provide traders with insights into potential price movements and strategies.
Market Analysis
Current Market Overview
At the current price of $3,314, gold is positioned between recent swing high and low levels. The swing high is noted at $3,438, while the swing low is at $3,120. Understanding these levels is crucial for traders looking to identify potential entry and exit points.
Support & Resistance Levels
Daily Time Frame
Support Levels:
$3,200
$3,250
$3,280
Resistance Levels:
$3,350
$3,400
$3,450
4-Hour Time Frame
Support Levels:
$3,280
$3,300
$3,250
Resistance Levels:
$3,350
$3,380
$3,400
These support and resistance levels are critical for understanding potential price action. Traders often look for price reactions at these levels to make informed decisions.
Fibonacci Retracement Levels
Using the recent swing high and low, we can identify the Fibonacci retracement levels:
23.6% Level: $3,250
38.2% Level: $3,180
50% Level: $3,175
61.8% Level: $3,100
These levels provide insight into potential reversal points in the market, helping traders to set targets and stop-loss orders effectively.
Exponential Moving Averages (EMA)
Daily Time Frame
EMA 50: $3,280
EMA 100: $3,250
EMA 200: $3,200
EMA 400: $3,180
4-Hour Time Frame
EMA 50: $3,300
EMA 100: $3,290
EMA 200: $3,270
EMA 400: $3,250
The EMAs are essential indicators for identifying trends. A price above the EMA lines suggests a bullish trend, while a price below indicates a bearish trend.
RSI Divergence
The Relative Strength Index (RSI) is a momentum oscillator that measures the speed and change of price movements. Currently, if we observe divergence between price and RSI, it could indicate a potential reversal or continuation of the trend. For example, if prices are making new highs while RSI is making lower highs, this could signal a bearish divergence.
Order Blocks
Order blocks represent areas where significant buying or selling occurred. Identifying these blocks can provide traders with insight into potential support and resistance zones. In the current market, key order blocks can be observed around the support and resistance levels mentioned earlier.
MACD Analysis
The Moving Average Convergence Divergence (MACD) is a trend-following momentum indicator that shows the relationship between two moving averages of a security’s price. Traders should look for crossovers and divergences in the MACD to confirm potential entry or exit points.
Summary of Key Levels
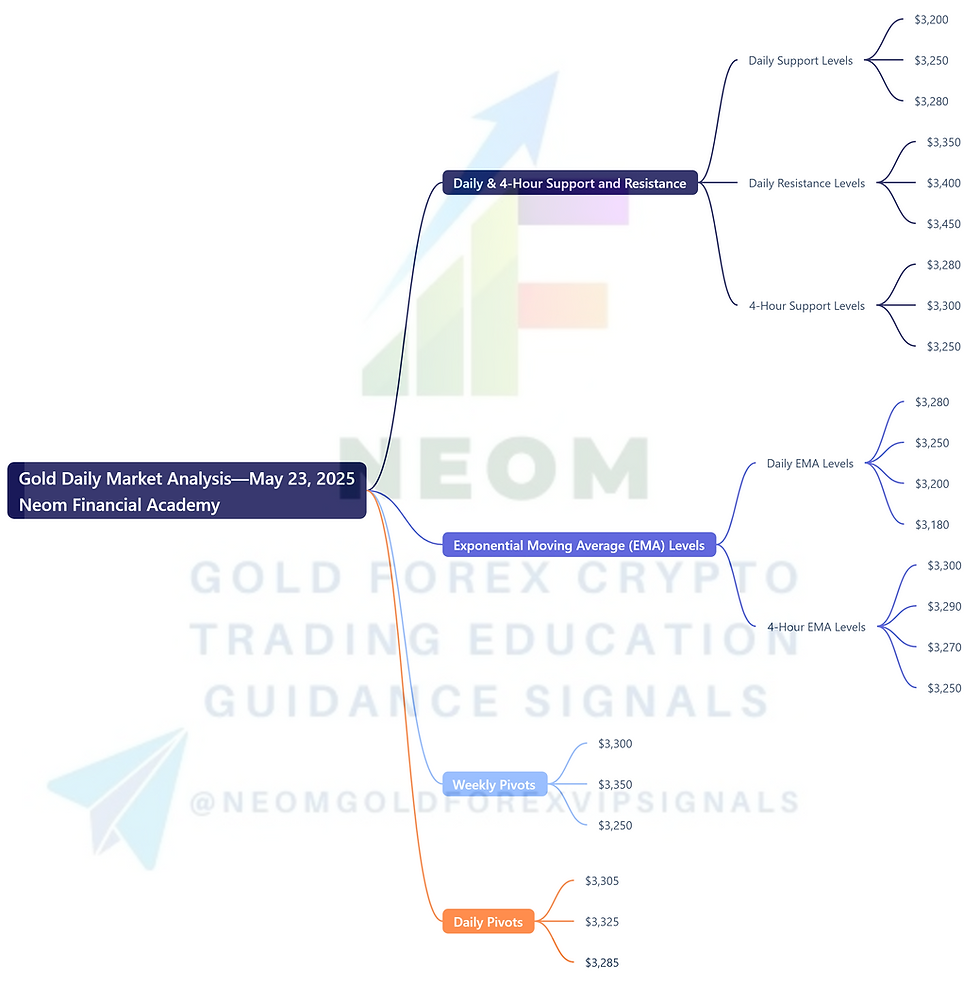
Daily & 4-Hour Support and Resistance
Daily Support Levels: $3,200, $3,250, $3,280
Daily Resistance Levels: $3,350, $3,400, $3,450
4-Hour Support Levels: $3,280, $3,300, $3,250
4-Hour Resistance Levels: $3,350, $3,380, $3,400
Exponential Moving Average (EMA) Levels
Daily EMA Levels:
EMA 50: $3,280
EMA 100: $3,250
EMA 200: $3,200
EMA 400: $3,180
4-Hour EMA Levels:
EMA 50: $3,300
EMA 100: $3,290
EMA 200: $3,270
EMA 400: $3,250
Weekly Pivots
Pivot Point: $3,300
Resistance 1: $3,350
Support 1: $3,250
Daily Pivots
Pivot Point: $3,305
Resistance 1: $3,325
Support 1: $3,285
Fibonacci Retracement Levels
23.6% Level: $3,250
38.2% Level: $3,180
50% Level: $3,175
61.8% Level: $3,100
Fundamental Analysis and Upcoming USD News
As we analyze the gold market, it’s crucial to consider the fundamental factors influencing price movements. The upcoming economic data releases concerning the USD can significantly impact gold prices. Key upcoming events include:
Federal Reserve Meetings: Decisions regarding interest rates can lead to fluctuations in gold prices, as higher interest rates typically strengthen the dollar and weaken gold.
Inflation Reports: Higher inflation can lead to increased demand for gold as a hedge, impacting its price positively.
Employment Data: Strong employment figures may lead to a stronger dollar, which could negatively affect gold prices.
Traders should keep an eye on these events as they can create volatility in the market, influencing both short-term and long-term trading decisions.
Conclusion
In conclusion, the current analysis of XAUUSD reveals critical support and resistance levels, along with significant indicators such as EMAs, Fibonacci levels, RSI divergence, and MACD. Understanding these elements can aid traders in making informed decisions. As the market continues to evolve, staying updated on both technical and fundamental factors will be essential for successful trading strategies in the gold market.


Comments