🟡 XAUUSD Daily Market Analysis—July 31, 2025
- Neom
- Jul 31, 2025
- 3 min read
Introduction
Welcome to today’s comprehensive market analysis of XAUUSD (Gold against the US Dollar). As of the current market price of 3298 USD, we will delve into the daily and 4-hour timeframes, utilizing a variety of technical indicators to provide a thorough understanding of the current market dynamics. This analysis will cover critical aspects such as Support & Resistance Levels, Fibonacci Retracement Levels, Exponential Moving Averages (EMA), RSI Divergence, Order Blocks, and MACD.
Let's explore how these indicators can guide your trading decisions in the gold market.
Market Overview
Current Price
Gold (XAUUSD): 3298 USD
Swing Levels
Swing High: 3438 USD
Swing Low: 3309 USD
Technical Analysis
Support & Resistance Levels
Daily Timeframe
Support Levels:
1st Support: 3309 USD
2nd Support: 3285 USD
3rd Support: 3270 USD
Resistance Levels:
1st Resistance: 3340 USD
2nd Resistance: 3360 USD
3rd Resistance: 3385 USD
4-Hour Timeframe
Support Levels:
1st Support: 3315 USD
2nd Support: 3300 USD
3rd Support: 3290 USD
Resistance Levels:
1st Resistance: 3330 USD
2nd Resistance: 3345 USD
3rd Resistance: 3355 USD
Fibonacci Retracement Levels
Using the swing high of 3438 USD and swing low of 3309 USD, the key Fibonacci retracement levels are established as follows:
23.6% Retracement: 3325 USD
38.2% Retracement: 3344 USD
50% Retracement: 3363 USD
61.8% Retracement: 3382 USD
These levels serve as potential reversal points in the market.
Exponential Moving Averages (EMA)
Daily Timeframe
EMA 50: 3315 USD
EMA 100: 3290 USD
EMA 200: 3275 USD
EMA 400: 3250 USD
4-Hour Timeframe
EMA 50: 3305 USD
EMA 100: 3295 USD
EMA 200: 3280 USD
EMA 400: 3260 USD
The EMA levels indicate the trend direction, with shorter EMAs reacting quicker to price changes.
RSI Divergence
The Relative Strength Index (RSI) is currently indicating a divergence on the daily timeframe. While the price has been making higher highs, the RSI has shown lower highs, suggesting a potential reversal or correction in the current bullish trend.
Order Blocks
Order blocks identified on the daily timeframe are significant areas where institutional buying and selling have occurred. The primary order block is located around 3310 USD, which aligns closely with our support levels, indicating a strong demand zone.
MACD Analysis
The Moving Average Convergence Divergence (MACD) is currently showing bullish momentum, with the MACD line above the signal line. This indicates that the market may continue its upward trajectory unless we see a significant shift in momentum.
Summary of Key Levels
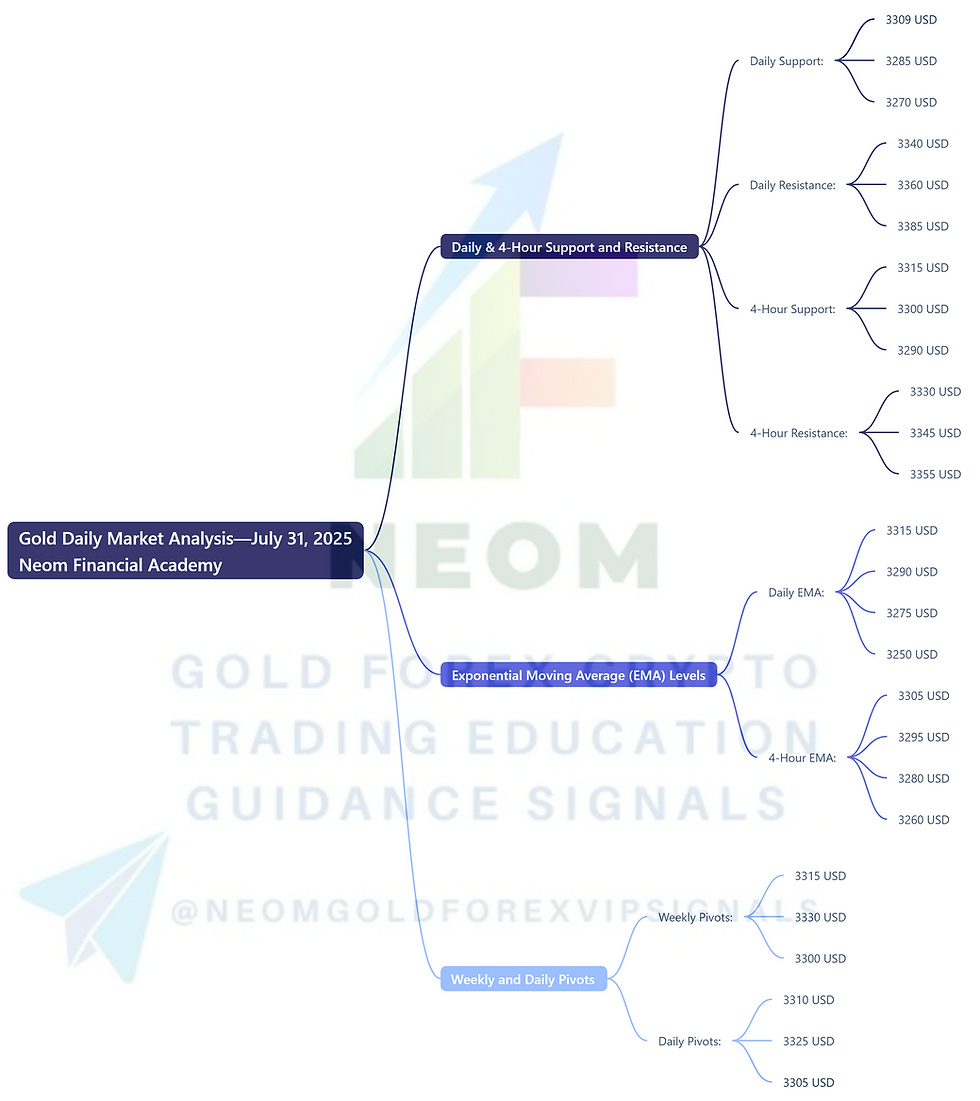
Daily & 4-Hour Support and Resistance
Daily Support: 3309 USD, 3285 USD, 3270 USD
Daily Resistance: 3340 USD, 3360 USD, 3385 USD
4-Hour Support: 3315 USD, 3300 USD, 3290 USD
4-Hour Resistance: 3330 USD, 3345 USD, 3355 USD
Exponential Moving Average (EMA) Levels
Daily EMA:
EMA 50: 3315 USD
EMA 100: 3290 USD
EMA 200: 3275 USD
EMA 400: 3250 USD
4-Hour EMA:
EMA 50: 3305 USD
EMA 100: 3295 USD
EMA 200: 3280 USD
EMA 400: 3260 USD
Weekly and Daily Pivots
Weekly Pivots:
Pivot Point: 3315 USD
Resistance 1: 3330 USD
Support 1: 3300 USD
Daily Pivots:
Pivot Point: 3310 USD
Resistance 1: 3325 USD
Support 1: 3305 USD
Fibonacci Retracement Levels
23.6%: 3325 USD
38.2%: 3344 USD
50%: 3363 USD
61.8%: 3382 USD
Fundamental Analysis and Upcoming USD News
As we look ahead, it’s crucial to consider upcoming economic events that could impact the gold market. Key USD news to watch for includes:
Federal Reserve Interest Rate Decision: Scheduled for next week, this decision will significantly influence gold prices as interest rates affect the opportunity cost of holding non-yielding assets like gold.
US Non-Farm Payrolls: Set to be released in the upcoming month, this report will provide insights into the health of the US labor market, directly impacting USD strength and, consequently, gold prices.
These events may create volatility in the market, and traders should remain vigilant and adapt their strategies accordingly.
Conclusion
In summary, today's analysis of XAUUSD highlights critical support and resistance levels, Fibonacci retracement levels, and various indicators that can guide trading decisions. With the current market price at 3298 USD, understanding these levels and indicators is essential for navigating the gold market effectively. Keep an eye on upcoming economic events that may influence market dynamics.
By staying informed and utilizing these insights, traders can make more educated decisions in the gold market.


Comments