🟡 XAUUSD Daily Market Analysis—July 29, 2025
- Neom
- Jul 29, 2025
- 3 min read
Introduction
Gold (XAUUSD) has always been a focal point for investors and traders, especially in times of economic uncertainty. As of today, the live market price of gold stands at 3312 USD. This analysis will provide a comprehensive overview of the daily and 4-hour time frames, utilizing various technical indicators such as Fibonacci Retracement Levels, Exponential Moving Averages (EMA), RSI divergence, support and resistance levels, and more. By the end of this analysis, you will have a clear understanding of the current market dynamics and how they can influence your trading decisions.
Market Analysis
Current Price Overview
Current Gold Price: 3312 USD
Swing High: 3365 USD
Swing Low: 3309 USD
Support & Resistance Levels
Daily Time Frame
Support Levels:
First Support: 3309 USD (Swing Low)
Second Support: 3280 USD
Third Support: 3260 USD
Resistance Levels:
First Resistance: 3365 USD (Swing High)
Second Resistance: 3380 USD
Third Resistance: 3400 USD
4-Hour Time Frame
Support Levels:
First Support: 3310 USD
Second Support: 3295 USD
Third Support: 3285 USD
Resistance Levels:
First Resistance: 3340 USD
Second Resistance: 3355 USD
Third Resistance: 3370 USD
Fibonacci Retracement Levels
Using the recent swing high and swing low, we can derive the Fibonacci retracement levels:
Key Fibonacci Levels:
23.6%: 3325 USD
38.2%: 3340 USD
50.0%: 3350 USD
61.8%: 3360 USD
Exponential Moving Averages (EMA)
Daily Time Frame
EMA 50: 3315 USD
EMA 100: 3305 USD
EMA 200: 3280 USD
EMA 400: 3250 USD
4-Hour Time Frame
EMA 50: 3310 USD
EMA 100: 3300 USD
EMA 200: 3285 USD
EMA 400: 3260 USD
RSI Divergence
The Relative Strength Index (RSI) currently shows a divergence on the daily time frame, indicating potential reversal points. The RSI is hovering around 55, suggesting that the market is not yet overbought or oversold, providing a balanced outlook for traders.
Order Blocks
Order blocks identified on the 4-hour chart suggest potential areas where significant buying or selling has occurred. Key order blocks are located around 3310 USD and 3340 USD, which could serve as pivot points for future price action.
MACD Analysis
The Moving Average Convergence Divergence (MACD) is currently bullish on the daily time frame, with the MACD line above the signal line. This indicates positive momentum in the gold market, supporting further upward movement.
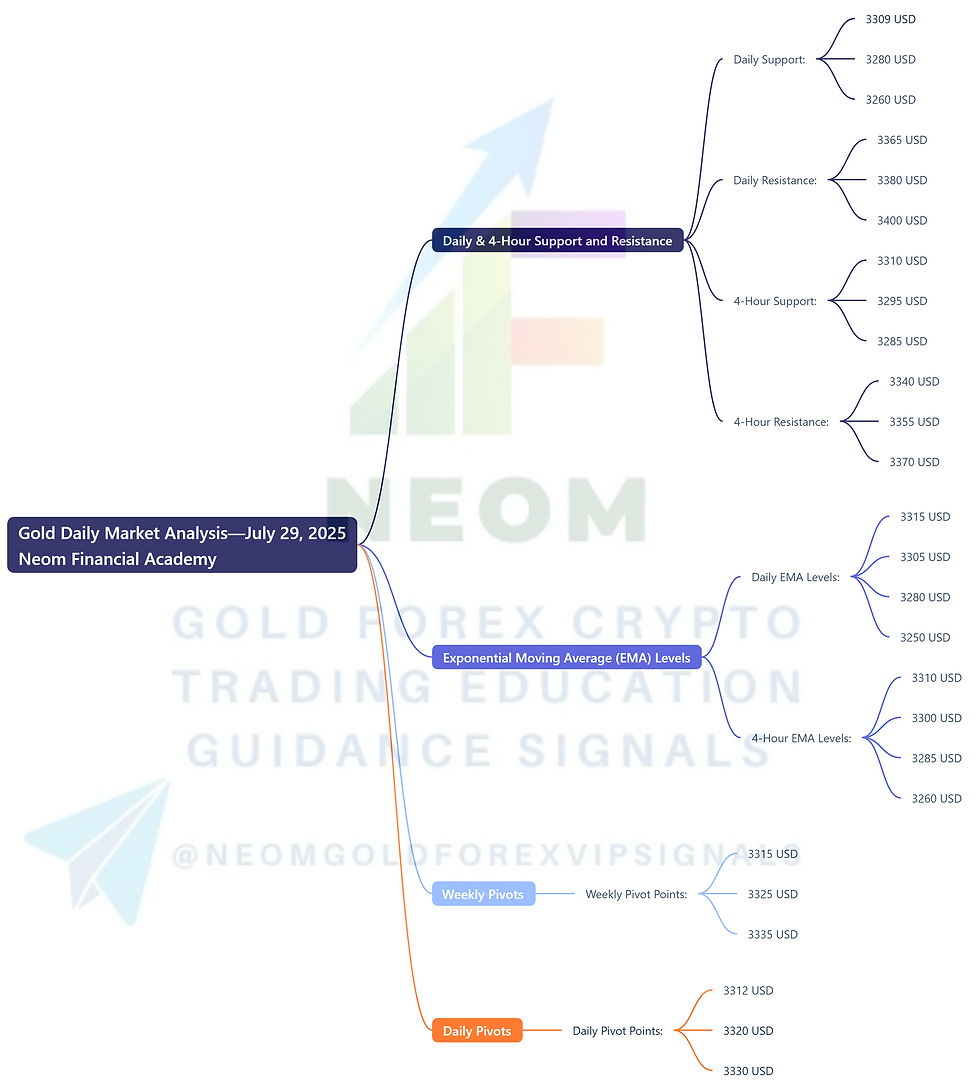
Summary of Key Levels
Daily & 4-Hour Support and Resistance
Daily Support: 3309 USD, 3280 USD, 3260 USD
Daily Resistance: 3365 USD, 3380 USD, 3400 USD
4-Hour Support: 3310 USD, 3295 USD, 3285 USD
4-Hour Resistance: 3340 USD, 3355 USD, 3370 USD
Exponential Moving Average (EMA) Levels
Daily EMA Levels:
EMA 50: 3315 USD
EMA 100: 3305 USD
EMA 200: 3280 USD
EMA 400: 3250 USD
4-Hour EMA Levels:
EMA 50: 3310 USD
EMA 100: 3300 USD
EMA 200: 3285 USD
EMA 400: 3260 USD
Weekly Pivots
Weekly Pivot Points:
First Pivot: 3315 USD
Second Pivot: 3325 USD
Third Pivot: 3335 USD
Daily Pivots
Daily Pivot Points:
First Pivot: 3312 USD
Second Pivot: 3320 USD
Third Pivot: 3330 USD
Fibonacci Retracement Levels
Key Levels:
23.6%: 3325 USD
38.2%: 3340 USD
50.0%: 3350 USD
61.8%: 3360 USD
Fundamental Analysis and Upcoming USD News
As we look ahead, several upcoming USD news events could significantly impact the gold market. Key events to watch include:
Federal Reserve Interest Rate Decision: Scheduled for next month, this decision will influence the strength of the USD and, consequently, the price of gold.
US Non-Farm Payrolls (NFP): This monthly report, due in the coming weeks, will provide insights into the US labor market and economic health, affecting investor sentiment towards gold.
Consumer Price Index (CPI) Release: The upcoming CPI data will be critical in assessing inflation, which often drives gold prices higher as investors seek a hedge against inflation.
These events are crucial for traders and investors in the gold market, as they can lead to increased volatility and shifts in market sentiment.
Conclusion
In conclusion, the XAUUSD market is currently at a pivotal point, with various technical indicators providing insights into potential price movements. By closely monitoring support and resistance levels, Fibonacci retracement levels, and key economic news, traders can make informed decisions. As always, remain vigilant and adjust your strategies according to market conditions.


Comments