🟡 XAUUSD Daily Market Analysis—10 June 2026
- Neom
- 5 days ago
- 3 min read
Introduction
The gold market, represented by XAUUSD, has been a focal point for traders and investors seeking safe-haven assets. As of today, June 10, 2026, gold is trading at 4178 USD. This analysis aims to provide a comprehensive overview of the daily and 4-hour time frames, utilizing various technical indicators including Fibonacci Retracement Levels, EMA, RSI divergence, and more.
Market Overview
Current Price: 4178 USD
Gold's price movements are influenced by a variety of factors including economic data, geopolitical tensions, and market sentiment. Understanding the current technical landscape is crucial for making informed trading decisions.
Technical Analysis
Support & Resistance Levels
Daily Time Frame:
Support Levels:
1st Support: 4366 USD (Swing Low)
2nd Support: 4170 USD
3rd Support: 4100 USD
Resistance Levels:
1st Resistance: 4595 USD (Swing High)
2nd Resistance: 4250 USD
3rd Resistance: 4300 USD
4-Hour Time Frame:
Support Levels:
1st Support: 4150 USD
2nd Support: 4120 USD
3rd Support: 4100 USD
Resistance Levels:
1st Resistance: 4200 USD
2nd Resistance: 4225 USD
3rd Resistance: 4250 USD
Fibonacci Retracement Levels
Utilizing Fibonacci retracement levels helps identify potential reversal zones. The key Fibonacci levels based on the recent swing high of 4595 USD and swing low of 4366 USD are:
23.6% Level: 4410 USD
38.2% Level: 4470 USD
50% Level: 4480 USD
61.8% Level: 4540 USD
These levels can serve as critical areas for traders to watch for potential price action.
Exponential Moving Averages (EMA)
Daily Time Frame:
EMA 50: 4220 USD
EMA 100: 4180 USD
EMA 200: 4150 USD
EMA 400: 4100 USD
4-Hour Time Frame:
EMA 50: 4190 USD
EMA 100: 4175 USD
EMA 200: 4155 USD
EMA 400: 4130 USD
The EMAs indicate the trend direction and potential support/resistance levels. The daily EMA levels suggest a bullish trend if the price remains above these averages.
RSI Divergence
The Relative Strength Index (RSI) is a momentum oscillator that measures the speed and change of price movements. Currently, the RSI indicates a divergence on the daily time frame, suggesting that while prices may be increasing, the momentum is weakening. This could signal a potential reversal or correction in the near term.
Order Blocks
Order blocks are areas where significant buying or selling has occurred, leading to strong price movements. In the current market context, we observe:
Bullish Order Block: 4150 USD to 4170 USD
Bearish Order Block: 4250 USD to 4270 USD
These order blocks can provide insights into potential price reactions as the market approaches these levels.
MACD Analysis
The Moving Average Convergence Divergence (MACD) is useful for identifying changes in momentum. Currently, the MACD shows a bullish crossover on the daily time frame, indicating potential upward momentum. However, traders should remain cautious of overbought conditions as indicated by the RSI.

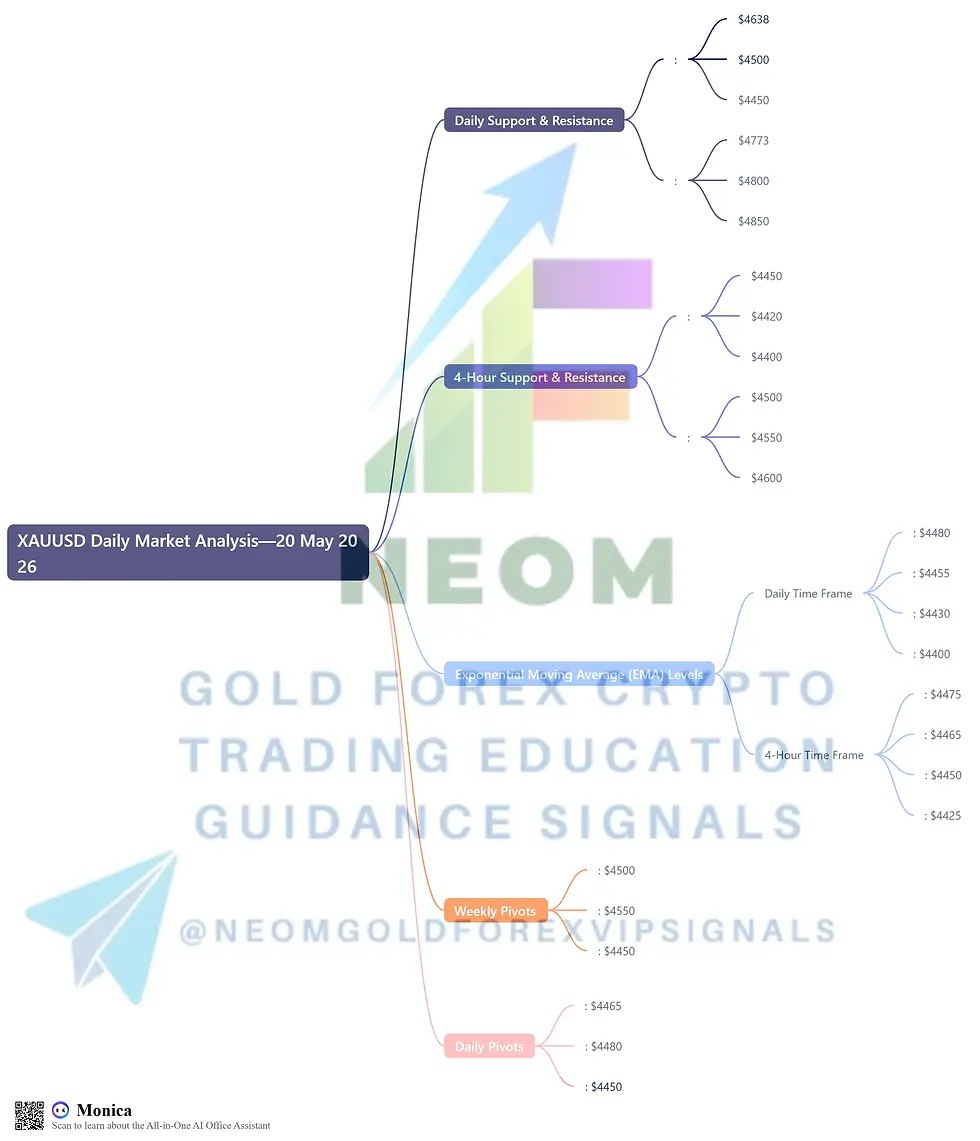
Summary of Key Levels
Daily Support and Resistance
Support Levels: 4366 USD, 4170 USD, 4100 USD
Resistance Levels: 4595 USD, 4250 USD, 4300 USD
Exponential Moving Average (EMA) Levels
Daily Time Frame:
EMA 50: 4220 USD
EMA 100: 4180 USD
EMA 200: 4150 USD
EMA 400: 4100 USD
4-Hour Time Frame:
EMA 50: 4190 USD
EMA 100: 4175 USD
EMA 200: 4155 USD
EMA 400: 4130 USD
Weekly Pivots
Weekly Pivot Point: 4200 USD
Weekly Resistance 1: 4250 USD
Weekly Support 1: 4150 USD
Daily Pivots
Daily Pivot Point: 4185 USD
Daily Resistance 1: 4210 USD
Daily Support 1: 4160 USD
Conclusion
As we analyze the XAUUSD market on June 10, 2026, it is evident that gold remains a critical asset for traders. The combination of support and resistance levels, Fibonacci retracement, EMAs, RSI divergence, order blocks, and MACD provides a comprehensive view of the market dynamics.


Comments