⚡USOIL Daily Analysis Based on Main Key Levels - April 9, 2025
- Neom
- Apr 9, 2025
- 1 min read
Daily Current Market Price (DCMP): 57.83 🔍
Critical Price Framework 🔥
Above DCMP (Resistance)
60.51 🟥 (Immediate Resistance)
63.02 ⚠️ (Upper Resistance Zone)
Below DCMP (Support)
57.74 🟩 (Key Support)
53.25 🛑 (Critical Floor)
Swing Levels
Swing High: 73.11
Swing Low: 68.87
Technical Confluence 🔍
Fibonacci & Price Alignment
57.74 Support: 61.8% Fib retracement of Q1 2025 downtrend + Institutional accumulation zone
60.51 Resistance: 38.2% Fib extension + Short-term liquidity cluster
Momentum Indicators
RSI: 44.3 (Neutral with bearish divergence on 4H chart)
MACD: Bearish histogram expansion on daily timeframe
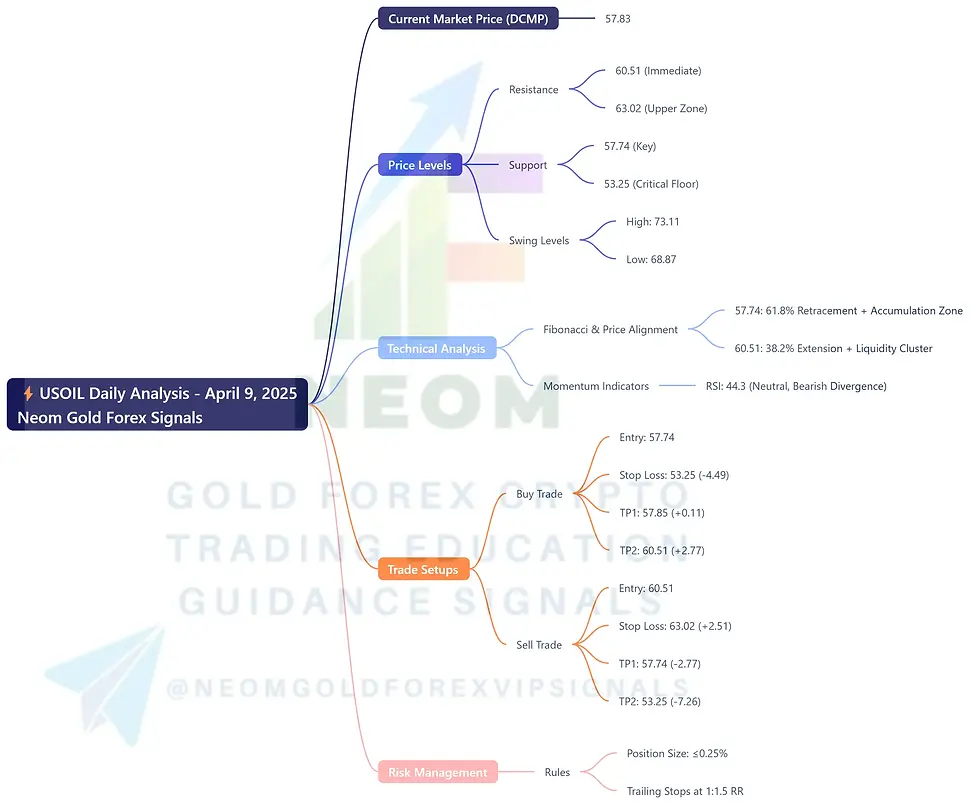
Intraday Trade Setups ⚡
🟢 Intraday Buy Trade Idea
Entry: 57.74 🟩 (Strong Support Zone)
Stop Loss: 53.25 🛑 (-4.49 pips)
Take Profit 1: 57.85 🎯 (+0.11 pips)
Take Profit 2: 60.51 🚀 (+2.77 pips)
Rationale: Confluence of Fib support and bullish order block alignment.
🔴 Intraday Sell Trade Idea
Entry: 60.51 🟥 (Key Resistance Cluster)
Stop Loss: 63.02 ⚠️ (+2.51 pips)
Take Profit 1: 57.74 📉 (-2.77 pips)
Take Profit 2: 53.25 🛑 (-7.26 pips)
Rationale: Price rejection at Fib extension + bearish liquidity grab pattern.
Key Technical Drivers 🛠️
Resistance Band: 60.51–63.02 (Fib extension + options expiry gamma zone)
Support Zone: 57.74–53.25 (OPEC price defense threshold)
Catalyst: EIA crude inventory data (10:30 AM EST)
Risk Management Protocol ⚠️
Position sizing ≤0.25% per trade (volatility-adjusted)
Trailing stops activated at 1:1.5 risk-reward ratio
Avoid trading during API/EIA data release window


Comments