📊 USOIL 12th February 2025 Daily Analysis Based on Main Key Levels
- Neom
- Feb 12, 2025
- 1 min read
Daily Current Market Price (DCMP): 72.99
Price consolidates above immediate support, with resistance dominance above DCMP. Critical swing levels define trend boundaries.
🔑 Key Technical Levels
🛑 Resistance (Sell Zones)
Immediate Resistance: 73.98
Strong Resistance: 74.34–76.88
🟢 Support (Buy Zones)
Immediate Support: 72.18
Strong Support: 71.73–67.49
📉 Swing Levels
Swing High: 80.73
Swing Low: 72.87
📊 Technical Snapshot
RSI: Neutral with bearish divergence forming near resistance.
MACD: Potential bearish crossover at higher timeframes.
Fibonacci: 72.18 aligns with 61.8% retracement; 73.98 marks 38.2% extension.
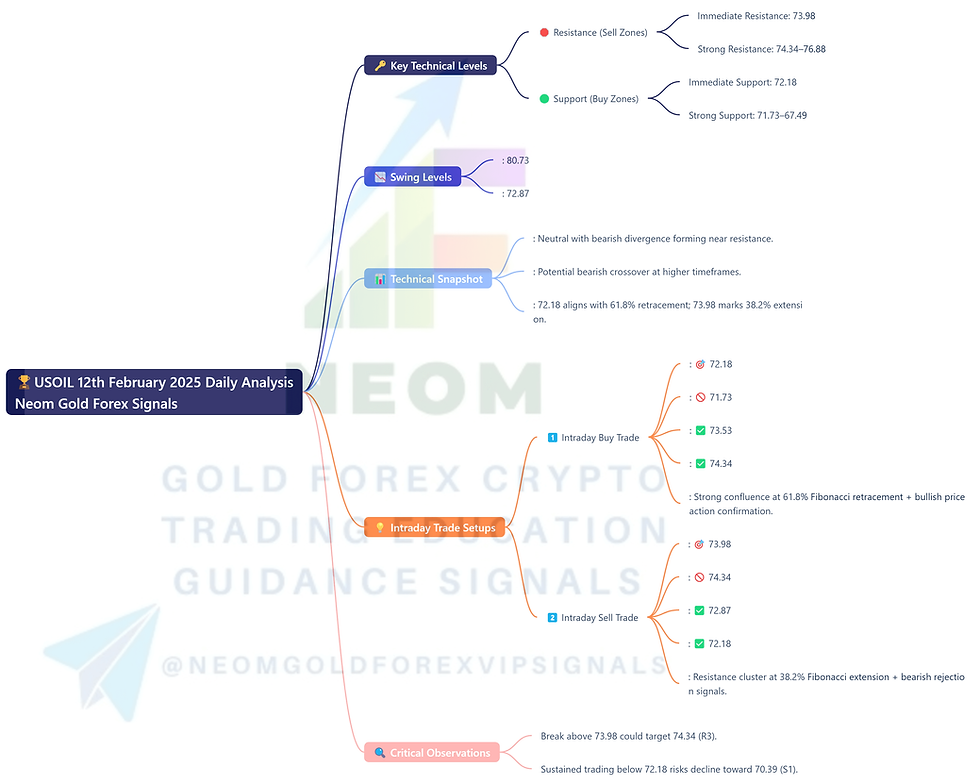
💡 Intraday Trade Setups
1️⃣ Intraday Buy Trade
Entry: 🎯 72.18
Stop Loss: 🚫 71.73
Take Profit 1: ✅ 73.53
Take Profit 2: ✅ 74.34
Rationale: Strong confluence at 61.8% Fibonacci retracement + bullish price action confirmation.
2️⃣ Intraday Sell Trade
Entry: 🎯 73.98
Stop Loss: 🚫 74.34
Take Profit 1: ✅ 72.87
Take Profit 2: ✅ 72.18
Rationale: Resistance cluster at 38.2% Fibonacci extension + bearish rejection signals.
🔍 Critical Observations
Break above 73.98 could target 74.34 (R3).
Sustained trading below 72.18 risks decline toward 70.39 (S1).
Watch for MACD crossover confirmation near key levels.
⚠️ Risk Note: Tight stops advised amid geopolitical supply risks and inventory data volatility.


Comments