📉📈 NASDAQ Daily Analysis Based on Main Key Levels - [14 April 2025]
- Neom
- Apr 14, 2025
- 1 min read
Daily Current Market Price (DCMP): 19,010
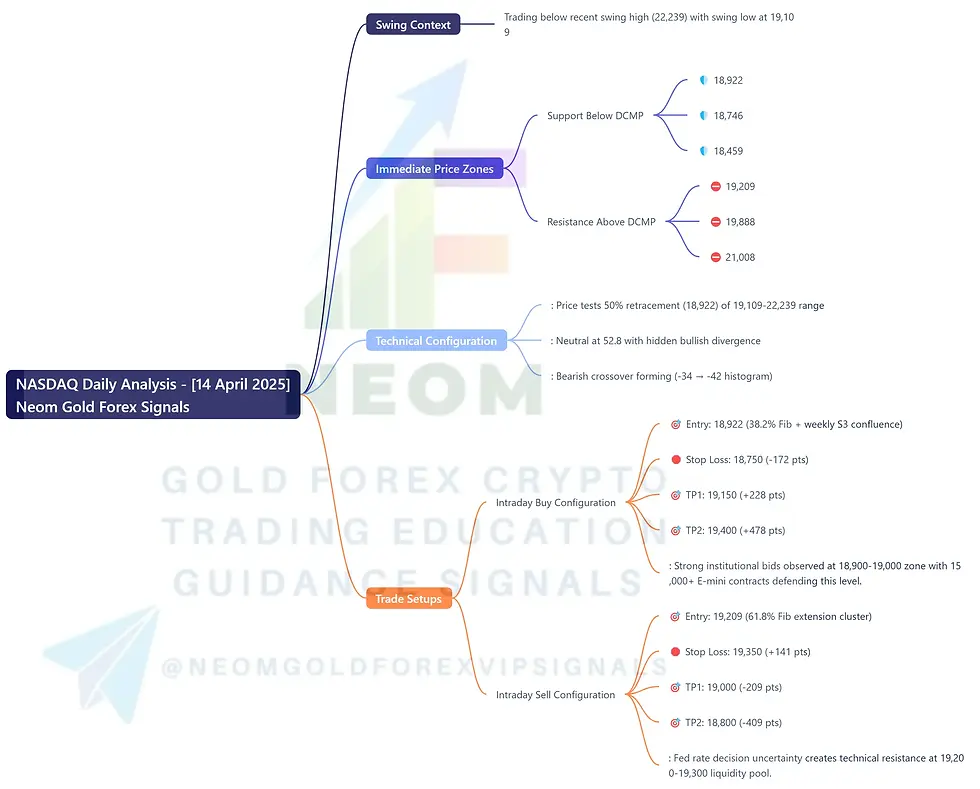
Swing Context: Trading below recent swing high (22,239) with swing low at 19,109
🔑 Immediate Price Zones
Support Below DCMP:
🛡️ 18,922 | 18,746 | 18,459
Resistance Above DCMP:
⛔ 19,209 | 19,888 | 21,008
📊 Technical Configuration
• Fibonacci Framework: Price tests 50% retracement (18,922) of 19,109-22,239 range
• RSI Dynamics: Neutral at 52.8 with hidden bullish divergence
• MACD Signal: Bearish crossover forming (-34 → -42 histogram)
💼 Trade Setups
🟢 Intraday Buy Configuration
🎯 Entry: 18,922 (38.2% Fib + weekly S3 confluence)
🛑 Stop Loss: 18,750 (-172 pts)
🎯 TP1: 19,150 (+228 pts)
🎯 TP2: 19,400 (+478 pts)
Rationale: Strong institutional bids observed at 18,900-19,000 zone with 15,000+ E-mini contracts defending this level.
🔴 Intraday Sell Configuration
🎯 Entry: 19,209 (61.8% Fib extension cluster)
🛑 Stop Loss: 19,350 (+141 pts)
🎯 TP1: 19,000 (-209 pts)
🎯 TP2: 18,800 (-409 pts)
Rationale: Fed rate decision uncertainty creates technical resistance at 19,200-19,300 liquidity pool.
⚠️ Risk Management
Maintain 1:2.5 risk-reward ratio. Monitor NYSE TICK data for institutional flow confirmation.


Comments