📈 NASDAQ 26th February 2025 Daily Analysis Based on Main Key Levels
- Neom
- Feb 26
- 1 min read
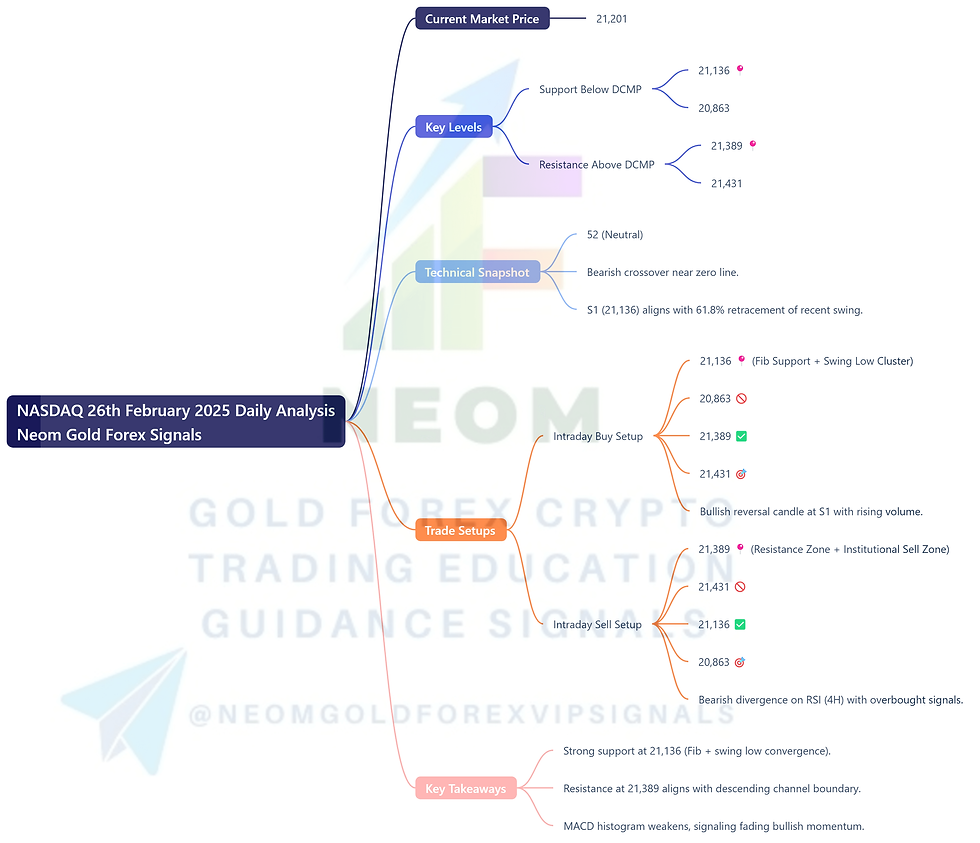
Daily Current Market Price (DCMP): 21,201
Swing High: 22,239 | Swing Low: 21,343
🔑 Key Levels
Support Below DCMP:
S1: 21,136 📍 | S2: 20,863
Resistance Above DCMP:
R1: 21,389 📍 | R2: 21,431
📉 Technical Snapshot
RSI: 52 (Neutral) | MACD: Bearish crossover near zero line.
Fib Level: S1 (21,136) aligns with 61.8% retracement of recent swing.
💼 Trade Setups
🟢 Intraday Buy Setup
Entry: 21,136 📍 (Fib Support + Swing Low Cluster)
Stop Loss: 20,863 🚫
Take Profit 1: 21,389 ✅ | Take Profit 2: 21,431 🎯
Confirmation:
Bullish reversal candle at S1 with rising volume.
🔴 Intraday Sell Setup
Entry: 21,389 📍 (Resistance Zone + Institutional Sell Zone)
Stop Loss: 21,431 🚫
Take Profit 1: 21,136 ✅ | Take Profit 2: 20,863 🎯
Confirmation:
Bearish divergence on RSI (4H) with overbought signals.
🎯 Conclusion
Trade range-bound strategies between 21,136 (S1) and 21,389 (R1). Monitor Fed policy cues and tech earnings.
✨ Pro Tip: Use Fib extension (161.8% at 22,052) for aggressive upside targets!
📌 Key Takeaways:
Strong support at 21,136 (Fib + swing low convergence).
Resistance at 21,389 aligns with descending channel boundary.
MACD histogram weakens, signaling fading bullish momentum.


Comments