📊 NASDAQ 20th February 2025 Daily Analysis: Strategic Trade Zones & Setups
- Neom
- Feb 20, 2025
- 1 min read
Daily Current Market Price (DCMP): 22,073
🔑 Critical Zones
Above DCMP (Resistance/Sell):
Immediate Resistance: 22,161 🚧
Strong Resistance: 22,315 🚨
Swing High: 21,944 (Daily timeframe)
Below DCMP (Support/Buy):
Immediate Support: 21,861 🛡️
Strong Support: 21,375 🎯
Swing Low: 20,622 (4H timeframe)
📊 Technical Snapshot
Key Levels:
Buy Zone: 21,861 | Sell Zone: 22,161
Fibonacci:
61.8% retracement aligns with 21,861 support.
38.2% extension at 22,161 resistance.
RSI: Neutral at 54, no divergence detected.
MACD: Bullish momentum weakening near 22,161 resistance.
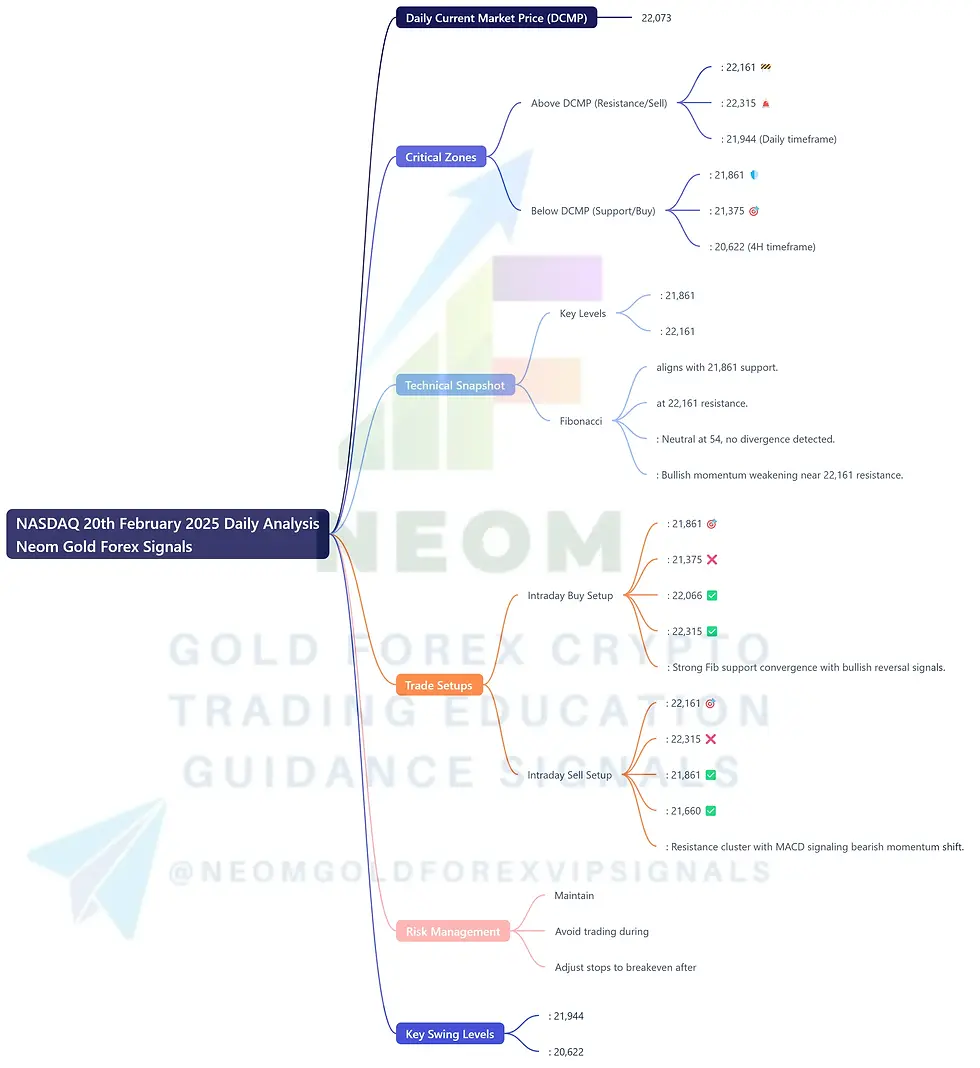
💼 Trade Setups
🟢 Intraday Buy Setup
Entry: 21,861 🎯
Stop Loss: 21,375 ❌
Take Profit 1: 22,066 ✅
Take Profit 2: 22,315 ✅
Rationale: Strong Fib support convergence with bullish reversal signals.
🔴 Intraday Sell Setup
Entry: 22,161 🎯
Stop Loss: 22,315 ❌
Take Profit 1: 21,861 ✅
Take Profit 2: 21,660 ✅
Rationale: Resistance cluster with MACD signaling bearish momentum shift.
⚠️ Risk Management
Maintain 1:3 risk-reward ratio.
Avoid trading during Fed speech windows.
Adjust stops to breakeven after TP1 is hit.
Key Swing Levels: High at 21,944 | Low at 20,622
🔍 Analysis integrates price action, Fibonacci retracements, and momentum indicators for high-confidence execution.


Comments