📊 Gold 20th January 2025 Daily Analysis Based on Main Key Levels
- Neom
- Jan 20, 2025
- 2 min read
Gold is trading at a Daily Current Market Price (DCMP) of 2703. Below is a comprehensive analysis highlighting key resistance and support levels, Fibonacci retracement and extension zones, RSI divergence, and MACD crossing. This analysis provides actionable trade setups to capitalize on market movements.
Key Levels Summary
Resistance Levels Above DCMP (2703):
🔺 Resistance 1: 2720
🔺 Resistance 2: 2736
🔺 Resistance 3: 2762
Support Levels Below DCMP (2703):
🟢 Support 1: 2694
🟢 Support 2: 2652
🟢 Support 3: 2626
Swing Levels
📊 Swing High: 2726
📊 Swing Low: 2614
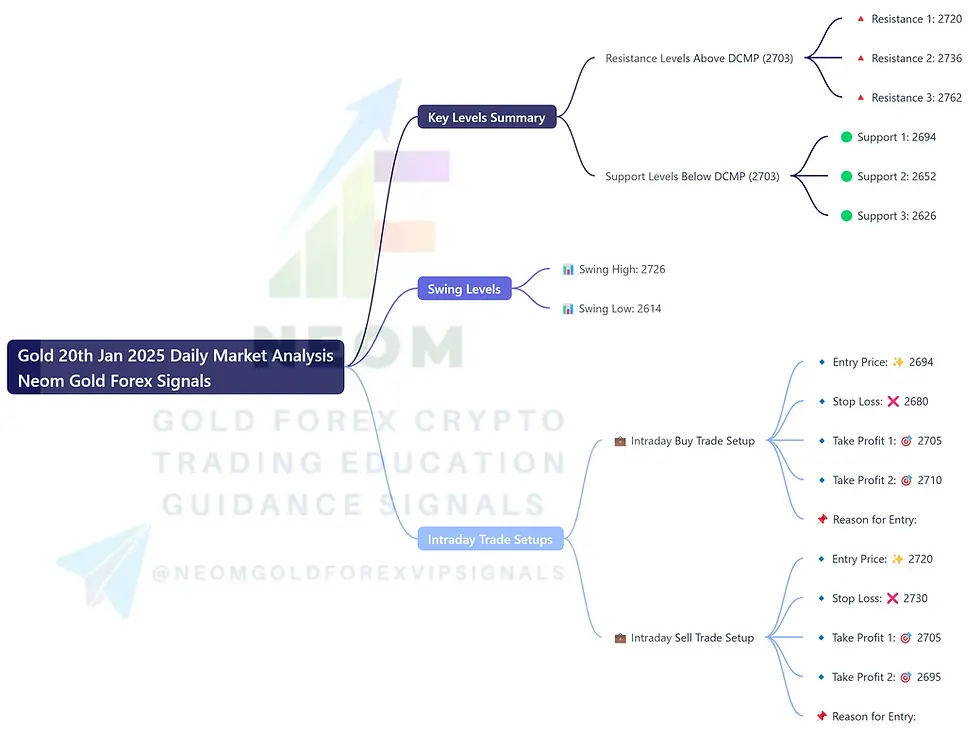
Intraday Trade Setups
💼 Intraday Buy Trade Setup
🔹 Entry Price: ✨ 2694
🔹 Stop Loss: ❌ 2680
🔹 Take Profit 1: 🎯 2705
🔹 Take Profit 2: 🎯 2710
📌 Reason for Entry:
The support level at 2694 is below the DCMP, establishing a strong buying zone. This level aligns with Fibonacci retracement and technical support. RSI divergence indicates oversold conditions, while MACD suggests a potential bullish reversal.
💼 Intraday Sell Trade Setup
🔹 Entry Price: ✨ 2720
🔹 Stop Loss: ❌ 2730
🔹 Take Profit 1: 🎯 2705
🔹 Take Profit 2: 🎯 2695
📌 Reason for Entry:
The resistance level at 2720 is above the DCMP, indicating a strong selling zone. This level aligns with Fibonacci extension and technical resistance.
RSI shows overbought conditions at this level, and MACD confirms a potential bearish reversal.
Analysis Summary
Fibonacci Levels: The resistance and support zones are derived from Fibonacci retracement and extension levels, highlighting potential reversal zones.
RSI Divergence: RSI signals overbought conditions at resistance levels and oversold conditions at support levels, confirming possible reversals.
MACD Crossing: MACD indicates bullish momentum at support levels and bearish momentum at resistance levels, providing additional confirmation for trade setups.
Conclusion
This analysis provides actionable trade setups and key levels to help traders make informed decisions in the gold market. With the current market price at 2703, traders can utilize the outlined resistance and support levels, along with technical indicators, to execute trades confidently.


Comments