💹 DXY Daily Analysis Based on Main Key Levels – March 24, 2025
- Neom
- Mar 24, 2025
- 1 min read
Daily Current Market Price (DCMP): 103.931
Critical Price Zones 🔑
Above DCMP (Resistance/Sell Zones):
Immediate Resistance: 104.247 🛑
Major Resistance: 104.489 🔥
Below DCMP (Support/Buy Zones):
Immediate Support: 103.855 🛡️
Major Support: 103.463–102.829 🟢
Swing Levels (Daily/4hr):
Swing High: 107.661 📈
Swing Low: 103.197 📉
Technical Framework 📊
RSI: Neutral at 49, signaling balanced momentum.
MACD: Bearish crossover near zero line, hinting at weakening upward pressure.
Fibonacci: Key confluence at 103.855 (38.2% retracement) and 104.247 (61.8% extension).
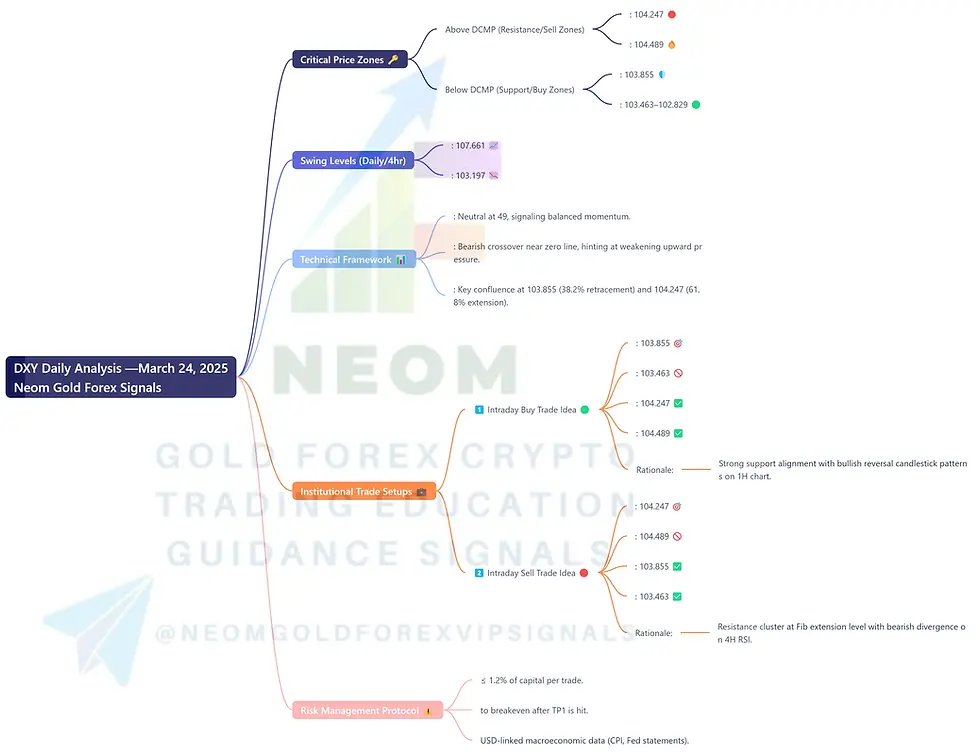
Institutional Trade Setups 💼
1️⃣ Intraday Buy Trade Idea 🟢
Entry: 103.855 🎯
Stop Loss: 103.463 🚫
Take Profit 1: 104.247 ✅
Take Profit 2: 104.489 ✅
Rationale: Strong support alignment with bullish reversal candlestick patterns on 1H chart.
2️⃣ Intraday Sell Trade Idea 🔴
Entry: 104.247 🎯
Stop Loss: 104.489 🚫
Take Profit 1: 103.855 ✅
Take Profit 2: 103.463 ✅
Rationale: Resistance cluster at Fib extension level with bearish divergence on 4H RSI.
Risk Management Protocol ⚠️
Position size ≤1.2% of capital per trade.
Adjust stops to breakeven after TP1 is hit.
Monitor USD-linked macroeconomic data (CPI, Fed statements).
This analysis combines Fibonacci retracements, institutional liquidity zones, and momentum indicators. Confirm with real-time order flow before execution. 🚨


Comments