💹 DXY 5th February 2025 Daily Analysis Based on Main Key Levels
- Neom
- Feb 5
- 1 min read
Daily Current Market Price (DCMP): 108.514
🎯 Critical Price Zones
Below DCMP (Support):
🛡️ 108.012 (Intraday Buy Trigger)
🛡️ 107.500 (Swing Low Anchor)
Above DCMP (Resistance):
🎯 108.621 (Intraday Sell Zone)
🎯 109.438 (Key Swing High)
🔍 Technical Snapshot
Swing Levels: Recent swing high at 110.176 | Swing low at 107.500 (4hr/Daily timeframe)
Fibonacci Grid: Price consolidating near 61.8% retracement (108.514) of 107.500-110.176 range
MACD: Neutral histogram, bearish crossover potential
RSI: 49 (Neutral, no divergence observed)
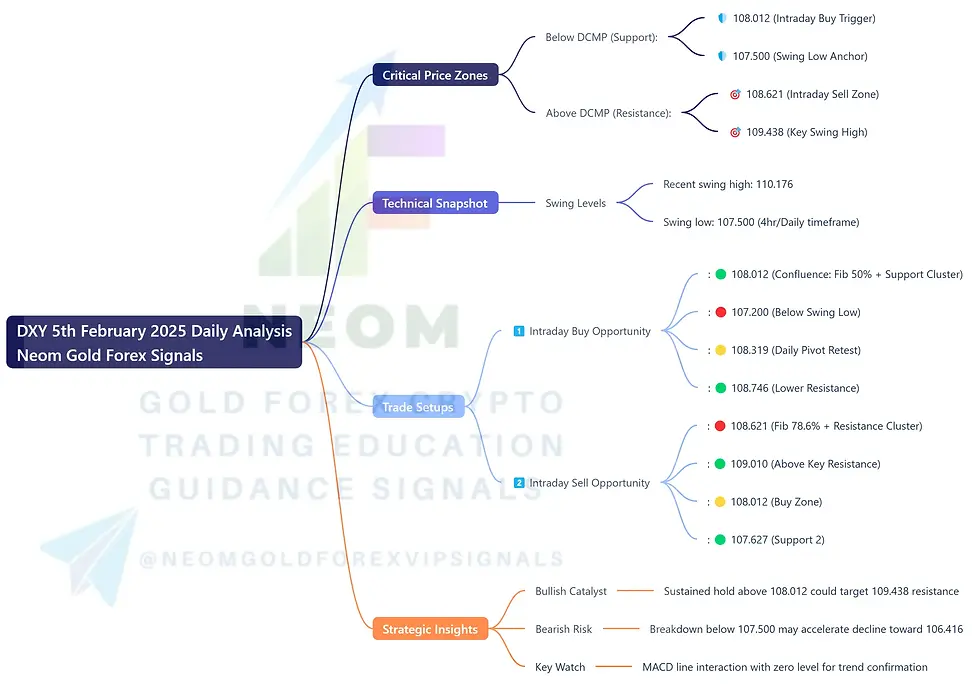
💡 Trade Setups
1️⃣ Intraday Buy Opportunity
Entry: 🟢 108.012 (Confluence: Fib 50% + Support Cluster)
Stop Loss: 🔴 107.200 (Below Swing Low)
Take Profit 1: 🟡 108.319 (Daily Pivot Retest)
Take Profit 2: 🟢 108.746 (Lower Resistance)
2️⃣ Intraday Sell Opportunity
Entry: 🔴 108.621 (Fib 78.6% + Resistance Cluster)
Stop Loss: 🟢 109.010 (Above Key Resistance)
Take Profit 1: 🟡 108.012 (Buy Zone)
Take Profit 2: 🟢 107.627 (Support 2)
📊 Strategic Insights
Bullish Catalyst: Sustained hold above 108.012 could target 109.438 resistance
Bearish Risk: Breakdown below 107.500 may accelerate decline toward 106.416
Key Watch: MACD line interaction with zero level for trend confirmation
Analysis combines Fibonacci retracement (107.500-110.176 swing) with volume-based validation. Tight risk management advised in volatile USD environment. ⚡


Comments