📈 DXY 20th March 2025 Daily Analysis Based on Main Key Levels
- Neom
- Mar 20, 2025
- 1 min read
The Daily Current Market Price (DCMP) for DXY stands at 103.914. Below and above this level, we identify critical support and resistance zones that will guide our intraday trading strategy. Here’s a crisp and accurate analysis of the key levels and trade setups.
Key Levels Summary 🎯
Below DCMP (103.914): Support Levels
BUY/Support1: 103.290
BUY/Support2: 103.136
BUY/Support3: 102.887
Above DCMP (103.914): Resistance Levels
SELL/Resistance1: 103.789
SELL/Resistance2: 103.943
SELL/Resistance3: 104.193
Swing High & Low
Swing High (Daily): 107.661
Swing Low (Daily): 106.126
Technical Indicators 📊
RSI Divergence: Neutral, indicating no clear overbought or oversold conditions.
MACD Crossing: Slight bearish crossover, suggesting potential short-term downward pressure.
Fibonacci Levels: Key retracement levels align with support and resistance zones, reinforcing their significance.
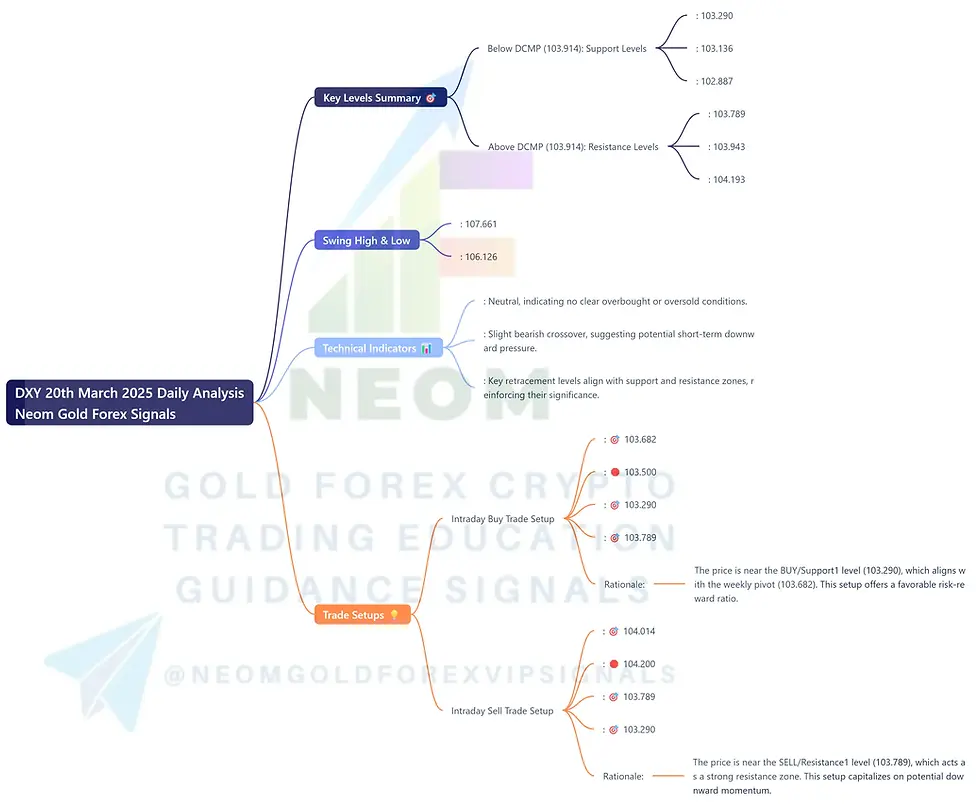
Trade Setups 💡
Intraday Buy Trade Setup
Entry Price: 🎯 103.682
Stop Loss: 🛑 103.500
Take Profit 1: 🎯 103.290
Take Profit 2: 🎯 103.789
Rationale: The price is near the BUY/Support1 level (103.290), which aligns with the weekly pivot (103.682). This setup offers a favorable risk-reward ratio.
Intraday Sell Trade Setup
Entry Price: 🎯 104.014
Stop Loss: 🛑 104.200
Take Profit 1: 🎯 103.789
Take Profit 2: 🎯 103.290
Rationale: The price is near the SELL/Resistance1 level (103.789), which acts as a strong resistance zone. This setup capitalizes on potential downward momentum.
Conclusion 🏁
DXY’s current price action is consolidating around key levels, offering clear intraday trading opportunities. The Intraday Buy setup at 103.682 and the Intraday Sell setup at 104.014 are both well-defined with tight stop losses and achievable take profit targets. Always monitor price action and adjust strategies accordingly.


Comments