🟡 BTCUSD Daily Market Analysis—May 23, 2026
Introduction
The cryptocurrency market continues to exhibit volatility, with Bitcoin (BTC) at a live price of $75,532. In this analysis, we delve into the daily and 4-hour time frames, employing various technical indicators to provide a comprehensive overview of the current market landscape. Our focus will be on Support & Resistance Levels, Fibonacci Retracement Levels, Exponential Moving Averages (EMA), RSI Divergence, Order Blocks, and MACD.
Market Overview
Current Price: $75,532
Bitcoin remains a focal point for traders and investors alike, with its price movements influenced by a myriad of factors. Understanding the technical indicators can provide valuable insights into potential price movements.
Swing High and Swing Low
Swing High: $97,942
Swing Low: $64,912
Technical Analysis
Support & Resistance Levels
Daily Time Frame
Support Levels:
Level 1: $72,000
Level 2: $70,500
Level 3: $68,000
Resistance Levels:
Level 1: $78,000
Level 2: $80,500
Level 3: $82,000
4-Hour Time Frame
Support Levels:
Level 1: $74,000
Level 2: $73,200
Level 3: $72,500
Resistance Levels:
Level 1: $76,000
Level 2: $77,500
Level 3: $78,500
Fibonacci Retracement Levels
Utilizing Fibonacci retracement levels provides insight into potential reversal points based on the daily swing high and low:
Key Levels:
23.6%: $82,000
38.2%: $78,000
61.8%: $72,000
These levels indicate potential areas of interest for both buyers and sellers.
Exponential Moving Averages (EMA)
Daily Time Frame
EMA 50: $74,500
EMA 100: $73,000
EMA 200: $70,000
EMA 400: $66,000
4-Hour Time Frame
EMA 50: $75,000
EMA 100: $74,000
EMA 200: $72,000
EMA 400: $69,000
The EMAs indicate the overall trend direction, with shorter EMAs providing insight into potential entry points.
RSI Divergence
The Relative Strength Index (RSI) currently shows a divergence that traders should monitor closely. A bullish divergence may suggest a potential upward price movement, while a bearish divergence could indicate a reversal.
Order Blocks
Identifying order blocks can help traders understand where significant buying or selling has occurred. Key order blocks are present around:
Bullish Order Block: $70,000 - $72,000
Bearish Order Block: $78,000 - $80,000
These zones highlight areas of potential price reaction.
MACD Analysis
The Moving Average Convergence Divergence (MACD) is currently showing signs of bullish momentum. Traders should look for crossovers and divergence signals for potential entry points.
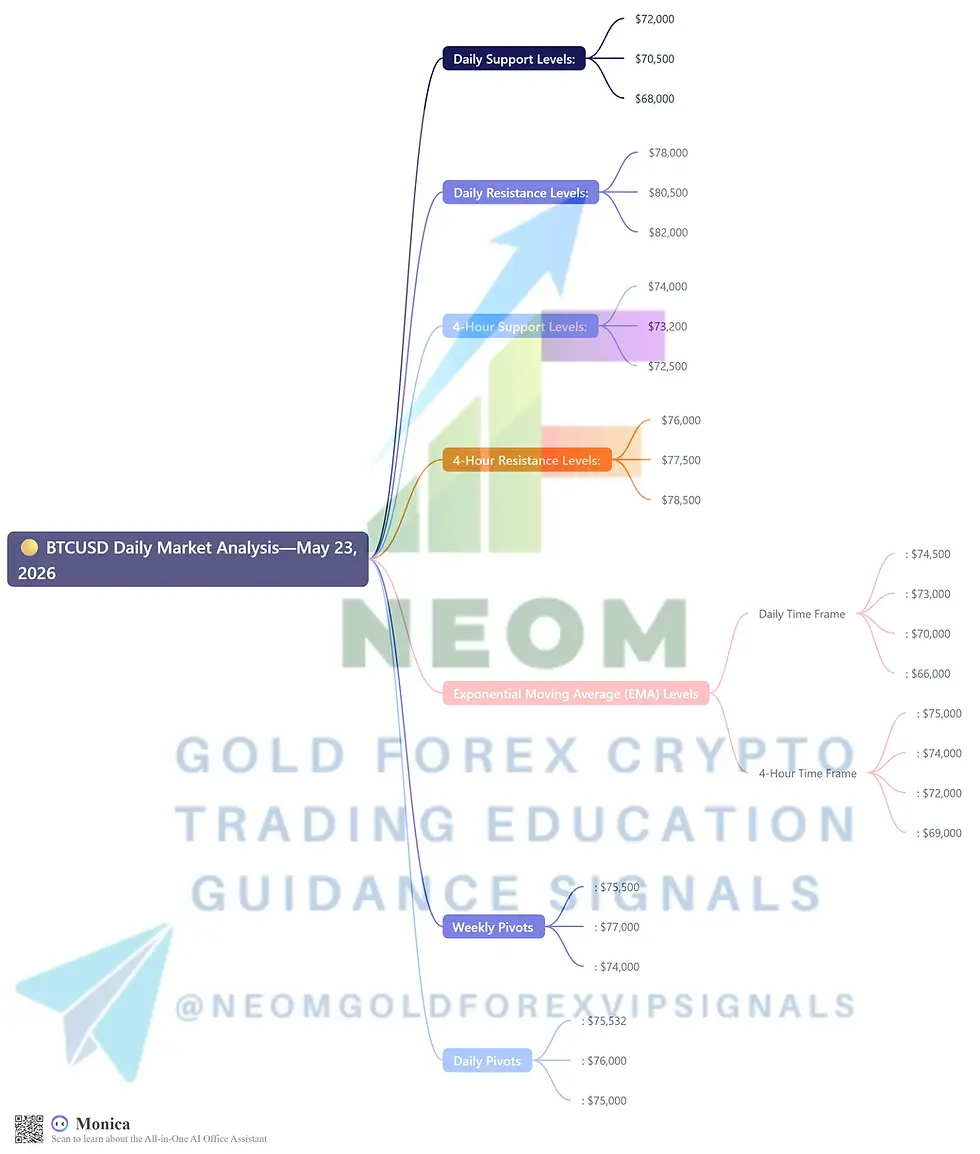
Summary
Key Levels
Daily Support Levels:
$72,000
$70,500
$68,000
Daily Resistance Levels:
$78,000
$80,500
$82,000
4-Hour Support Levels:
$74,000
$73,200
$72,500
4-Hour Resistance Levels:
$76,000
$77,500
$78,500
Exponential Moving Average (EMA) Levels
Daily Time Frame
EMA 50: $74,500
EMA 100: $73,000
EMA 200: $70,000
EMA 400: $66,000
4-Hour Time Frame
EMA 50: $75,000
EMA 100: $74,000
EMA 200: $72,000
EMA 400: $69,000
Weekly Pivots
Pivot Point: $75,500
Resistance: $77,000
Support: $74,000
Daily Pivots
Pivot Point: $75,532
Resistance: $76,000
Support: $75,000
Conclusion
In conclusion, the BTCUSD market presents a dynamic landscape influenced by various technical indicators. Traders should remain vigilant in monitoring support and resistance levels, EMAs, RSI divergence, order blocks, and MACD signals. By leveraging these insights, traders can make informed decisions in this volatile market.


Comments