🟡 BTCUSD Daily Market Analysis—June 19, 2025
- Neom
- Jun 19, 2025
- 3 min read
Introduction
In the ever-evolving cryptocurrency market, Bitcoin (BTC) continues to capture the attention of traders and investors alike. As of today, the BTCUSD live price stands at $104,988. This analysis provides a detailed examination of the daily and 4-hour time frames using various technical indicators, including Fibonacci Retracement Levels, Exponential Moving Averages (EMA), RSI divergence, support and resistance levels, order blocks, and MACD. Additionally, we will highlight key upcoming USD news that may impact the BTCUSD market. 🚀
Market Overview
Current Market Price
BTCUSD Live Price: $104,988 💰
Key Swing Levels
Swing High: $110,587 📈
Swing Low: $103,388 📉
Technical Analysis
Support & Resistance Levels
Daily Time Frame
Support Levels:
S1: $103,388 (Swing Low) 🔻
S2: $102,500
S3: $101,000
Resistance Levels:
R1: $105,500 🔺
R2: $107,000
R3: $110,000
4-Hour Time Frame
Support Levels:
S1: $103,800 🔻
S2: $103,000
S3: $102,200
Resistance Levels:
R1: $105,200 🔺
R2: $106,000
R3: $107,500
Fibonacci Retracement Levels
Using the recent swing high and low, we can identify key Fibonacci levels:
23.6% Level: $105,200
38.2% Level: $104,500
61.8% Level: $103,800
These levels act as potential reversal points, and traders often use them to identify entry and exit points. 🎯
Exponential Moving Averages (EMA)
Daily Time Frame
EMA 50: $104,800
EMA 100: $104,300
EMA 200: $103,500
EMA 400: $102,000
4-Hour Time Frame
EMA 50: $104,600
EMA 100: $104,200
EMA 200: $103,800
EMA 400: $102,500
The EMAs provide insights into the overall trend direction. Currently, the price is above the 50 EMA on both time frames, indicating a bullish sentiment. 📈
RSI Divergence
The Relative Strength Index (RSI) is currently showing a divergence on the 4-hour time frame. While the price is making higher highs, the RSI is making lower highs, suggesting potential weakness in the bullish momentum. Traders should watch for a possible correction if this divergence continues. ⚠️
Order Blocks
Order blocks are significant price levels where large orders have been placed. In the current market, we can identify a bullish order block around the $103,800 level, which aligns with the 61.8% Fibonacci retracement. This area may serve as a strong support zone. 🛑
MACD Analysis
The Moving Average Convergence Divergence (MACD) indicator is currently showing a bullish crossover on the daily time frame, indicating potential upward momentum. However, caution is advised as the histogram is approaching zero, suggesting a possible weakening trend. 📉
Summary of Key Levels
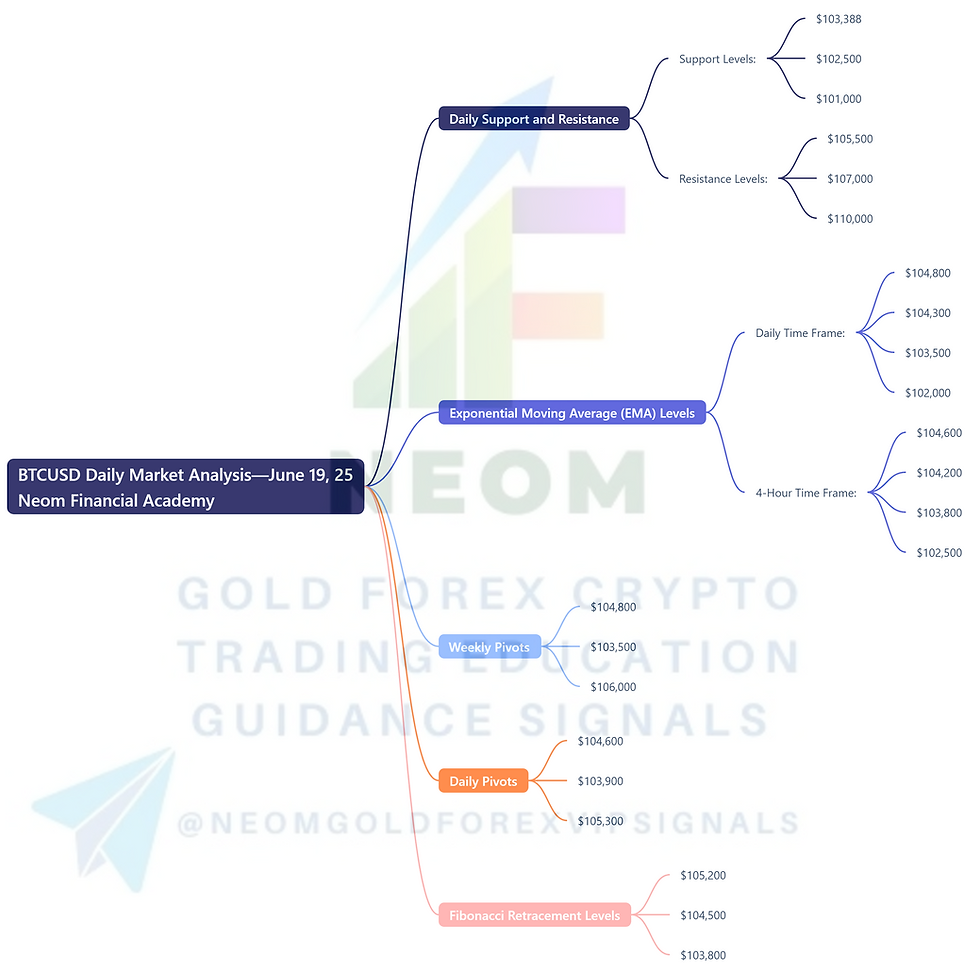
Daily Support and Resistance
Support Levels: $103,388, $102,500, $101,000 🔻
Resistance Levels: $105,500, $107,000, $110,000 🔺
Exponential Moving Average (EMA) Levels
Daily Time Frame:
EMA 50: $104,800
EMA 100: $104,300
EMA 200: $103,500
EMA 400: $102,000
4-Hour Time Frame:
EMA 50: $104,600
EMA 100: $104,200
EMA 200: $103,800
EMA 400: $102,500
Weekly Pivots
Pivot Point: $104,800
Support: $103,500
Resistance: $106,000
Daily Pivots
Pivot Point: $104,600
Support: $103,900
Resistance: $105,300
Fibonacci Retracement Levels
23.6% Level: $105,200
38.2% Level: $104,500
61.8% Level: $103,800
Fundamental Analysis and Upcoming USD News
As we look ahead, several key economic events are scheduled that could significantly impact the BTCUSD market:
Federal Reserve Interest Rate Decision: The Federal Reserve is set to announce its interest rate decision next week. A change in rates can influence investor sentiment in cryptocurrencies, including Bitcoin. 🏦
Inflation Data Release: Upcoming inflation reports may also sway market dynamics. Higher inflation could lead to increased interest in Bitcoin as a hedge against currency devaluation. 📊
Employment Data: The monthly employment report is expected soon, providing insights into the health of the U.S. economy. Strong employment figures may bolster the USD, potentially affecting Bitcoin's price. 📅
Traders should stay informed about these events, as they can lead to increased volatility in the BTCUSD market.
Conclusion
In summary, the BTCUSD market presents a complex landscape influenced by various technical indicators and fundamental factors. The current price of $104,988 sits within a critical range, with several support and resistance levels identified on both daily and 4-hour time frames. As we watch the market evolve, staying attuned to upcoming USD news will be essential for making informed trading decisions. 🔍


Comments