🟡 BTCUSD Daily Market Analysis—July 29, 2025
- Neom
- Jul 29, 2025
- 3 min read
Introduction
In the ever-evolving cryptocurrency landscape, Bitcoin (BTC) remains a focal point for traders and investors alike. As of today, the live price of BTCUSD stands at $118,728. This analysis will provide a detailed overview of the BTCUSD market using various technical indicators, including Fibonacci Retracement Levels, Exponential Moving Averages (EMA), RSI divergence, and more. We will also explore critical support and resistance levels on both daily and 4-hour timeframes, alongside essential fundamental insights regarding upcoming USD news.
Market Analysis
Current Market Overview
Bitcoin has experienced significant volatility in recent weeks, with a swing high of $123,236 and a swing low of $114,518. Understanding these price points is crucial for identifying potential market movements.
Support and Resistance Levels
Daily Timeframe:
Support Levels:
$116,500
$116,000
$115,500
Resistance Levels:
$119,000
$120,000
$121,500
4-Hour Timeframe:
Support Levels:
$118,000
$117,500
$117,000
Resistance Levels:
$119,500
$120,500
$121,000
Fibonacci Retracement Levels
Using the most recent swing high and low, we can identify critical Fibonacci retracement levels:
23.6%: $119,000
38.2%: $117,500
61.8%: $116,000
These levels provide potential reversal points that traders should monitor closely.
Exponential Moving Averages (EMA)
Daily Timeframe:
EMA 50: $117,200
EMA 100: $116,800
EMA 200: $115,600
EMA 400: $114,300
4-Hour Timeframe:
EMA 50: $118,600
EMA 100: $118,200
EMA 200: $117,000
EMA 400: $115,800
The EMAs indicate the overall trend direction and can act as dynamic support or resistance levels.
RSI Divergence
The Relative Strength Index (RSI) is currently showing a divergence that traders should note. As the price approaches resistance levels, the RSI indicates weakening momentum, suggesting a potential reversal or correction might be imminent.
Order Blocks
Identifying order blocks on both timeframes reveals areas of significant buying or selling interest. On the daily chart, we observe a strong order block around $116,500, which could act as a critical support zone. Conversely, on the 4-hour chart, an order block near $119,500 may serve as resistance.
MACD Analysis
The Moving Average Convergence Divergence (MACD) indicator shows a bullish crossover on the daily timeframe, indicating potential upward momentum. However, traders should remain cautious, as the MACD histogram is beginning to flatten, signaling possible indecision in the market.
Summary of Key Levels
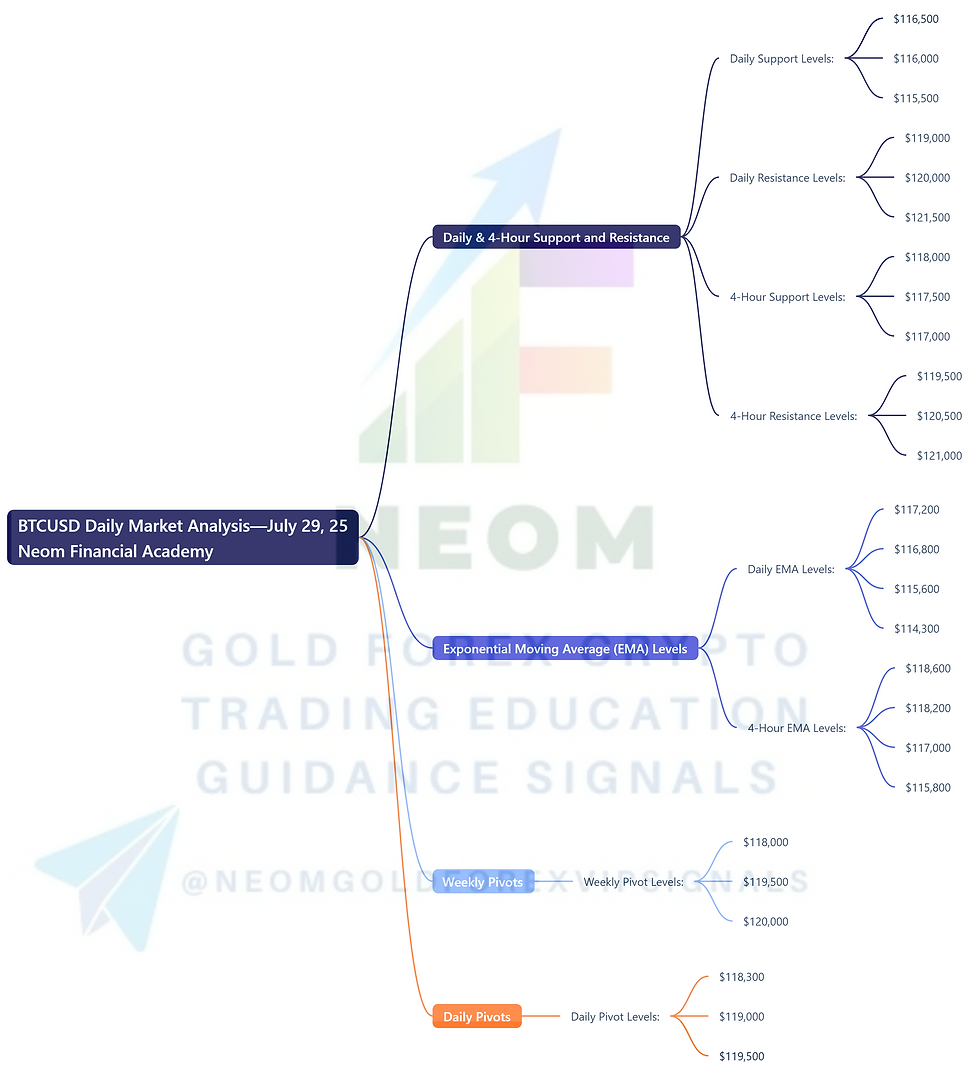
Daily & 4-Hour Support and Resistance
Daily Support Levels: $116,500, $116,000, $115,500
Daily Resistance Levels: $119,000, $120,000, $121,500
4-Hour Support Levels: $118,000, $117,500, $117,000
4-Hour Resistance Levels: $119,500, $120,500, $121,000
Exponential Moving Average (EMA) Levels
Daily EMA Levels:
EMA 50: $117,200
EMA 100: $116,800
EMA 200: $115,600
EMA 400: $114,300
4-Hour EMA Levels:
EMA 50: $118,600
EMA 100: $118,200
EMA 200: $117,000
EMA 400: $115,800
Weekly Pivots
Weekly Pivot Levels:
Pivot Level 1: $118,000
Pivot Level 2: $119,500
Pivot Level 3: $120,000
Daily Pivots
Daily Pivot Levels:
Pivot Level 1: $118,300
Pivot Level 2: $119,000
Pivot Level 3: $119,500
Fibonacci Retracement Levels
Fibonacci Levels: 23.6% ($119,000), 38.2% ($117,500), 61.8% ($116,000)
Fundamental Analysis and Upcoming USD News
As we look ahead, several important USD news events could impact the BTCUSD market. Traders should keep an eye on the following upcoming releases:
Federal Reserve Meeting: Scheduled for next week, this meeting will discuss interest rates and economic outlook, which could lead to significant market movements.
Consumer Price Index (CPI) Release: Expected in the coming weeks, the CPI data will provide insights into inflation trends that may influence the USD's strength against Bitcoin.
Understanding these fundamental factors is crucial for anticipating potential shifts in the BTCUSD market.
Conclusion
In conclusion, the current BTCUSD market presents various opportunities and challenges for traders. By closely monitoring key support and resistance levels, Fibonacci retracement levels, and relevant technical indicators, traders can make informed decisions. Additionally, staying updated on upcoming USD news will help navigate the complexities of the cryptocurrency market.


Comments