🟡 BTCUSD Daily Market Analysis—20 May 2026
Introduction
As of May 20, 2026, the Bitcoin market (BTCUSD) is experiencing notable fluctuations, with a live price of $76,691 USD. This analysis aims to provide a detailed overview of the current market conditions, focusing on both daily and 4-hour time frames. We will utilize various technical indicators, including Fibonacci Retracement Levels, Exponential Moving Averages (EMAs), RSI divergence, and Smart Money Concepts (SMC), to identify support and resistance levels, order blocks, and pivot points.
Market Overview
Current Price: $76,691 USD
Swing High: $82,835
Swing Low: $75,986
Technical Analysis
1. Support & Resistance Levels
Daily Time Frame
Support Levels:
First Support: $75,986 (Swing Low)
Second Support: $75,000 (Psychological Level)
Third Support: $73,500 (Recent Low)
Resistance Levels:
First Resistance: $82,835 (Swing High)
Second Resistance: $80,000 (Psychological Level)
Third Resistance: $85,000 (Previous High)
4-Hour Time Frame
Support Levels:
First Support: $75,000 (Key Support)
Second Support: $74,500 (Intraday Support)
Third Support: $73,000 (Round Number)
Resistance Levels:
First Resistance: $78,000 (Key Resistance)
Second Resistance: $79,500 (Recent High)
Third Resistance: $80,500 (Psychological Level)
2. Fibonacci Retracement Levels
Using Fibonacci retracement from the recent swing high of $82,835 to the swing low of $75,986, we can identify critical retracement levels:
23.6% Level: $79,300
38.2% Level: $78,000
50% Level: $77,000
61.8% Level: $76,200
These levels are key for identifying potential reversal points and areas of interest for traders.
3. Exponential Moving Averages (EMA)
Daily Time Frame
EMA 50: $76,500
EMA 100: $75,800
EMA 200: $74,200
EMA 400: $72,000
The EMAs indicate a bullish trend as the price is currently above the EMA lines, suggesting upward momentum.
4-Hour Time Frame
EMA 50: $76,800
EMA 100: $76,200
EMA 200: $75,500
EMA 400: $74,000
The EMAs on the 4-hour chart also confirm a bullish sentiment, with the price maintaining above key EMA levels.
4. RSI Divergence
The Relative Strength Index (RSI) on both daily and 4-hour time frames shows divergence, indicating potential reversal signals. Currently:
Daily RSI: 68 (Approaching overbought territory)
4-Hour RSI: 64 (Indicating potential overbought conditions)
This divergence suggests that while the price is rising, momentum may be weakening, warranting caution among traders.
5. Order Blocks
Order blocks are identified as regions where significant buying or selling has occurred. In the current analysis:
Bullish Order Block: $75,000 - $75,500 (Recent accumulation zone)
Bearish Order Block: $80,000 - $81,000 (Recent distribution zone)
These order blocks highlight areas where institutional traders may have placed their orders, providing insight into potential price reactions.
6. MACD Analysis
The Moving Average Convergence Divergence (MACD) indicator currently shows:
MACD Line: Above the Signal Line, indicating bullish momentum.
Histogram: Positive, suggesting increasing upward momentum.
This analysis supports the prevailing bullish sentiment in the market.
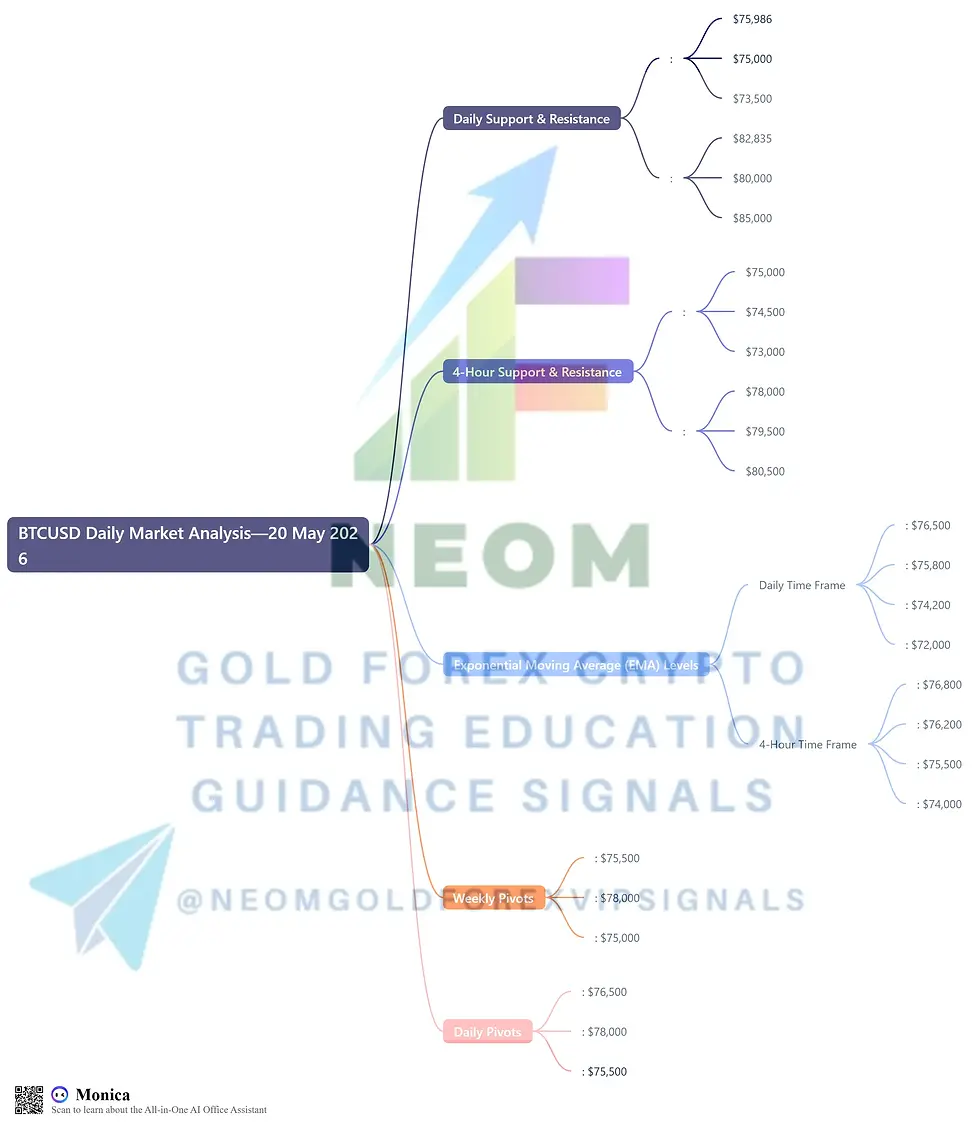
Summary of Key Levels
Daily Support & Resistance
Support: $75,986, $75,000, $73,500
Resistance: $82,835, $80,000, $85,000
4-Hour Support & Resistance
Support: $75,000, $74,500, $73,000
Resistance: $78,000, $79,500, $80,500
Exponential Moving Average (EMA) Levels
Daily Time Frame
EMA 50: $76,500
EMA 100: $75,800
EMA 200: $74,200
EMA 400: $72,000
4-Hour Time Frame
EMA 50: $76,800
EMA 100: $76,200
EMA 200: $75,500
EMA 400: $74,000
Weekly Pivots
Pivot Point: $75,500
Resistance 1: $78,000
Support 1: $75,000
Daily Pivots
Pivot Point: $76,500
Resistance 1: $78,000
Support 1: $75,500
Conclusion
In conclusion, the BTCUSD market presents a dynamic trading environment as of May 20, 2026. With the current price at $76,691 USD, traders should closely monitor the support and resistance levels, Fibonacci retracement points, and EMA trends. The analysis suggests a bullish sentiment; however, caution is advised due to RSI divergence and potential reversal signals. Keeping an eye on order blocks and MACD can help traders make informed decisions in this evolving market landscape.


Comments